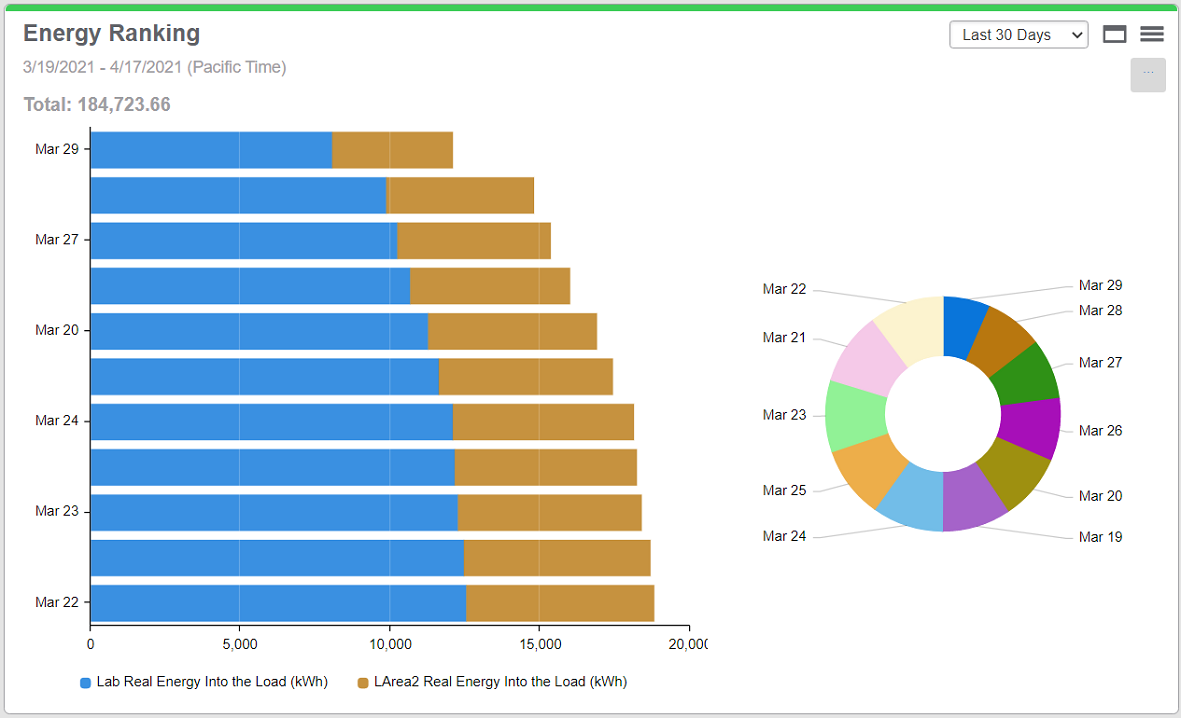
Aggregated Consumption Ranking gadget
NOTE: This gadget is part of the Energy Analysis Dashboards Module. This Module requires a separate license.
This gadget shows consumption data for multiple consumers, by aggregation period, over a selected time period. The information is shown side-by-side in a column or bar chart and a doughnut chart. The columns or bars are arranged in order of the aggregated consumption. The chart includes the aggregated total consumption.
Use this gadget to compare the consumption of consumers during specific time intervals, for example by hour, by day of week, or by day.
TIP: This gadget supports printing its complete data set and exporting its complete data set in PNG, JPG, SVG, CSV, and HTML format directly from the Web browser. To export the data, hover the mouse pointer over the download icon ![]() in the gadget and select Print or the desired format from the pop-up menu.
in the gadget and select Print or the desired format from the pop-up menu.
Example:

For information about configuring the gadget, see Configuring Gadgets.