Heat Map gadget
NOTE: This gadget is part of the Energy Analysis Dashboards Module. This Module requires a separate license.
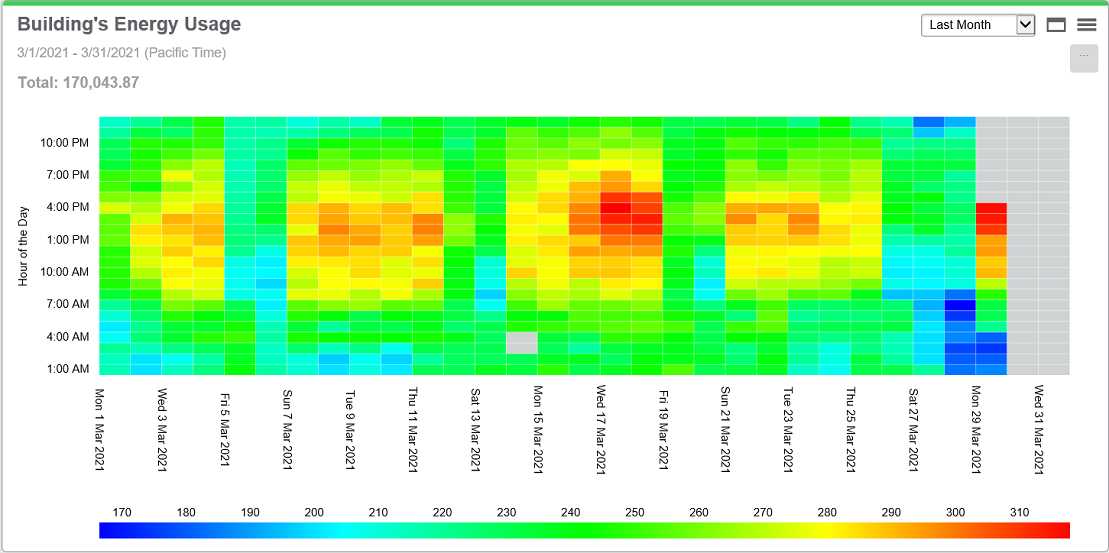
This gadget creates a graphical representation of your data where the individual values are represented as colors in a matrix format. The graphical display makes it easy to identify patterns in complex data sets.
Use this gadget with consumption data to identify usage patterns and anomalies.
TIP: This gadget supports printing its complete data set and exporting its complete data set in PNG, JPG, SVG, CSV, and HTML format directly from the Web browser. To export the data, hover the mouse pointer over the download icon ![]() in the gadget and select Print or the desired format from the pop-up menu.
in the gadget and select Print or the desired format from the pop-up menu.
Example:

For information about configuring the gadget, see Configuring Gadgets.