Sankey gadget
NOTE: This gadget is part of the Energy Analysis Dashboards Module. This Module requires a separate license.
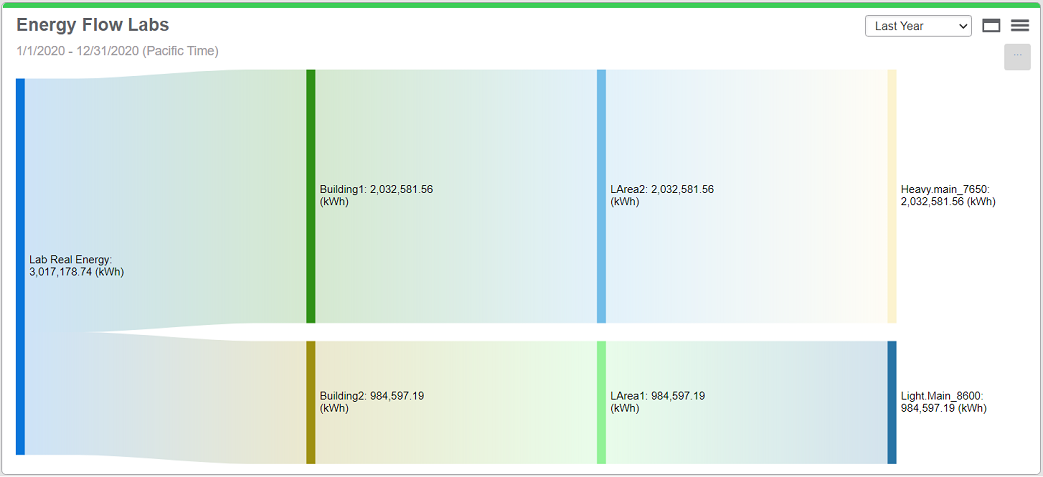
This gadget shows a flow diagram, in which the width of the arrows is proportional to the data values. The diagram starts as a combined flow for all the selected consumers, and then breaks out into individual flows for each consumer.
Use this gadget to show WAGES consumption broken down by load type, or to visualize consumption costs by consumer. You can also use it to show power losses.
NOTE: The Sankey gadget must be used with hierarchy data. The Sankey gadget automatically removes nodes with missing data from the display. A message is displayed in the chart if a node is removed.
TIP: This gadget supports printing its complete data set and exporting its complete data set in PNG, JPG, SVG, CSV, and HTML format directly from the Web browser. To export the data, hover the mouse pointer over the download icon ![]() in the gadget and select Print or the desired format from the pop-up menu.
in the gadget and select Print or the desired format from the pop-up menu.
Example:

TIP: Drag individual nodes horizontally or vertically in the chart for a better view.
For information about configuring the gadget, see Configuring Gadgets.