NOTE: This report is part of the Energy Billing Module. This module requires a separate license.
Summary
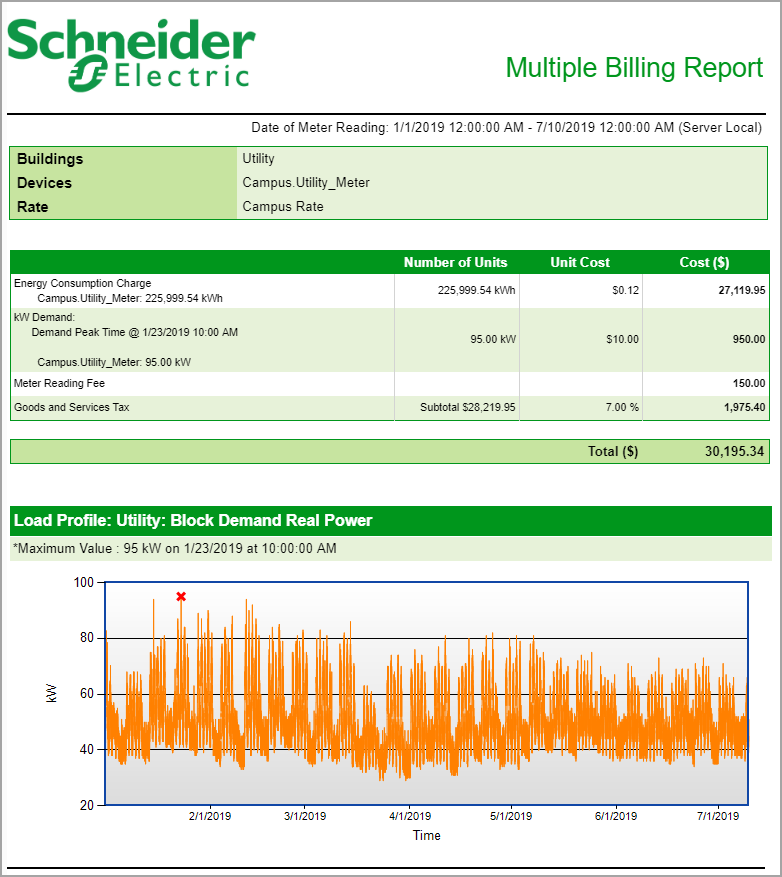
The Multiple Billing Report gives the same output as the Billing Report, but for more than one consumer. Use this report to create bills for more than one customer, rather than running the Billing Report multiple times.
Details
The output of this report is a single file, so if you choose to save or subscribe to a PDF file, then each bill appears on its own page for review and printing purposes.
Prerequisites
- The Energy Billing Module must be configured.
- The measurement data must be available as historical data logs in the database.
Report inputs
Type a title for the report in the text box.
To select a group of tenants that share the same rate, click Select Sources to open the source selector dialog. Select a view name or Virtual Meter in the View drop-down list. Select one or more tenant names, one or more devices under a tenant name, or one or more virtual meters. Click OK to add your selections to the report.
To add additional groups of tenants that share other rates, click the "Plus" icon besides the source selector.
To add rates for the groups of tenants, select a rate from the drop-down list for each tenant group.
Use this input to select the timeframe for the data you want to view in the report.
Select the reporting period from the dropdown list. The timeframe options in the timeframe dropdown are relative to the date the report is run. To run a report that starts and ends in the past, select the fixed date option. Type a start and end date in the date boxes or click the arrows beside the dates to display a pop-up calendar and select a date. Type a time in the time boxes or click the up and down arrows beside the time to adjust the hours or minutes up or down. You can also run a report that starts and ends in the future. You must manually add the future data. You can use any tool to generate future data. For example, use Manual Data Editor to manually enter measurement data.
Select the timezone you want to view timestamps in.
Select one or more measurements to be displayed in a trend chart at the end of each bill. The measurements are associated with the selected tenants. The date range for the chart is the same as the selected reporting period.
Select one or more usage measurements. These measurements will be displayed in a column chart, as past consumption for the selected tenants, at the end of each bill. The reporting period for these measurements is set through the Energy Period Comparison Range input.
Select the reporting period for the Previous Period Energy Measurement.
Select the reporting period from the dropdown list. The timeframe options in the timeframe dropdown are relative to the date the report is run. To run a report that starts and ends in the past, select the fixed date option. Type a start and end date in the date boxes or click the arrows beside the dates to display a pop-up calendar and select a date. Type a time in the time boxes or click the up and down arrows beside the time to adjust the hours or minutes up or down.
Select the timezone you want to view timestamps in.
Select the aggregation time interval for the Previous Period Energy Measurement data.
Select Yes to show the data for the Previous Period Energy Measurement chart by day of week (Sat, Sun, Mo, ...) when a monthly rollup period is selected. Select No to show the data by day of month (1, 2, 3, ...).
Save Billing Totals calculates the billing total per Tenant (Source) and writes the value back into the database so that it can be used in other applications, such as Dashboards, Diagrams or Reports.
Any notes appear at the bottom of the report page.
Select to order the list of bills in the report output by tenant name or by rate file name.
Select Yes to show an image instead of the Notes at the bottom of each bill. Select No to show the Notes instead of an image.
NOTE: The report displays the image file BillingFooter.jpg in ...\Web\ReportDepot\ION Reports\ION Report Packs\Billing Reports\ if it exists. There is no image provided by default. Create your own image and save it under the above name in the specified location.
Example:

NOTE: This example only shows selected content from the report, it does not show the entire report.