100 ms Report
Summary
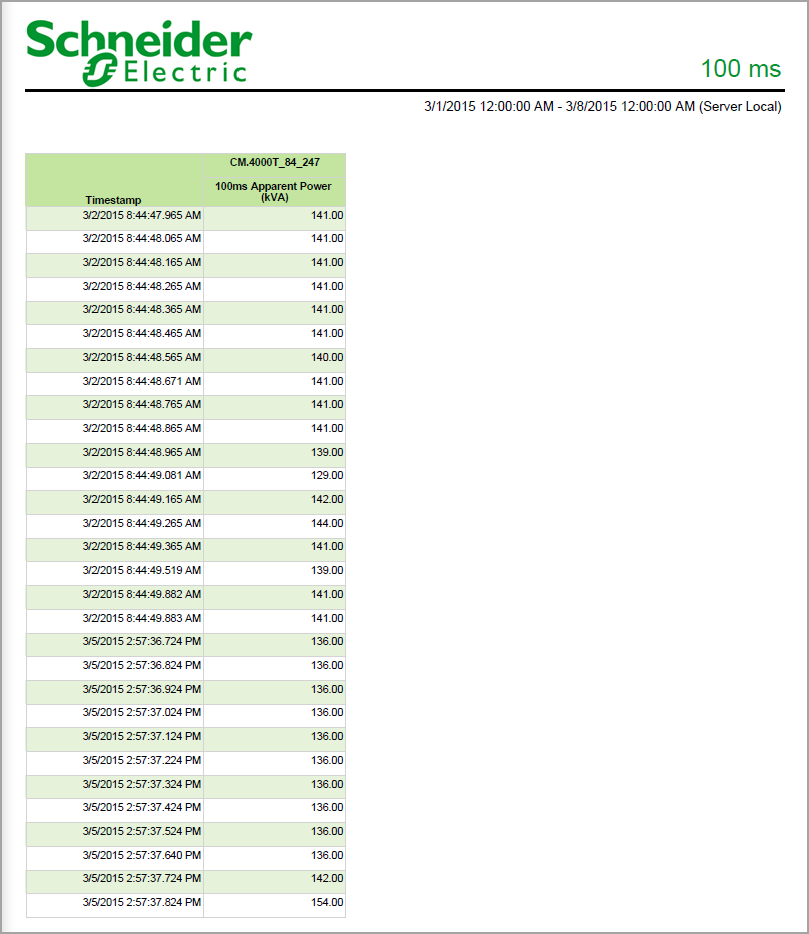
The 100ms Report shows 100 ms measurements from PowerLogic™ Circuit Monitors, for example CM4000 in a tabular format. Use this report to analyze high speed data samples from these devices.
Prerequisites
- The measurement data must be available as historical data logs in the database.
Report inputs
Type a title for the report in the text box.
Use this input to select the devices you want to include in the report.
Click Select Sources to open the Source Selector dialog. From the Grouping list, select the way in which you want to display the sources (for example by device type, by group name, and so on). Click + and - to expand and collapse items in the navigation tree. Click the check box beside a device (or group of devices) to select it. Click Select All or Select None in the top-right corner to select or clear all the check boxes.
After selecting the devices, click OK.
Use this input to select the measurements you want to include in the report.
Click Select Measurement to open the Measurement Selector dialog. Click + and - to expand and collapse items in the navigation tree. For reports where you can select multiple measurements, click the check box beside a measurement (or group of measurements) to select it. For reports where you can only select a single measurement, click the measurement name to select it.
After selecting the measurements, click OK.
Use this input to select the timeframe for the data you want to view in the report.
Select the reporting period from the dropdown list. The timeframe options in the timeframe dropdown are relative to the date the report is run. To run a report that starts and ends in the past, select the fixed date option. Type a start and end date in the date boxes or click the arrows beside the dates to display a pop-up calendar and select a date. Type a time in the time boxes or click the up and down arrows beside the time to adjust the hours or minutes up or down. You can also run a report that starts and ends in the future. You must manually add the future data. You can use any tool to generate future data. For example, use Manual Data Editor to manually enter measurement data.
Select the timezone you want to view timestamps in.
Click Yes to include data warnings in the report. If there are none, the section is not included. Click No to exclude this section.
Select an option for the format of the label describing the source. The options are Source Name, Source Description, and Combined Name/Description.
NOTE: The source description is the description that was entered in Management Console or Device Manager for a source, when the source was added or edited.
Example:

NOTE: This example only shows selected content from the report, it does not show the entire report.