Summary
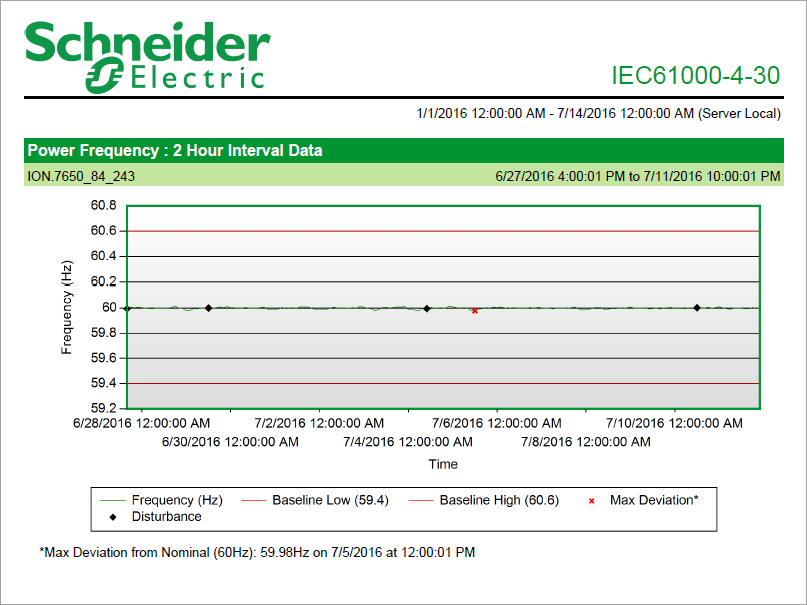
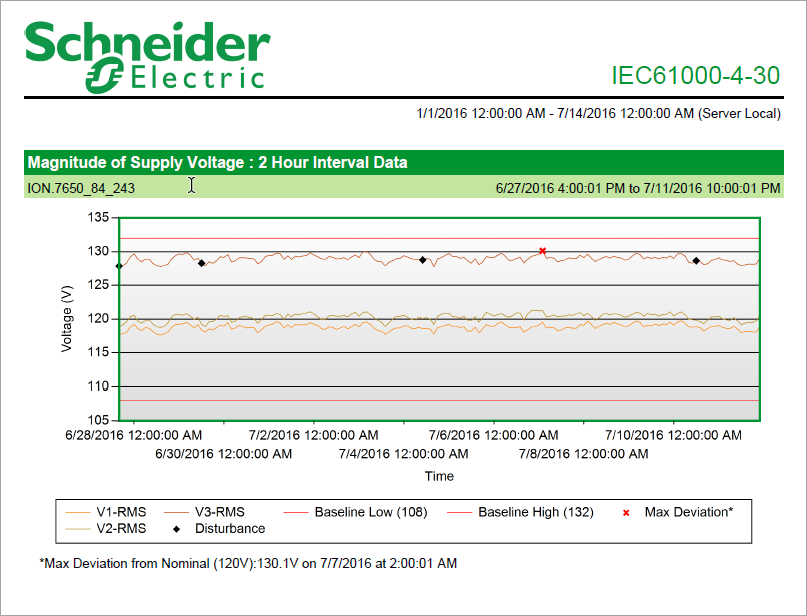
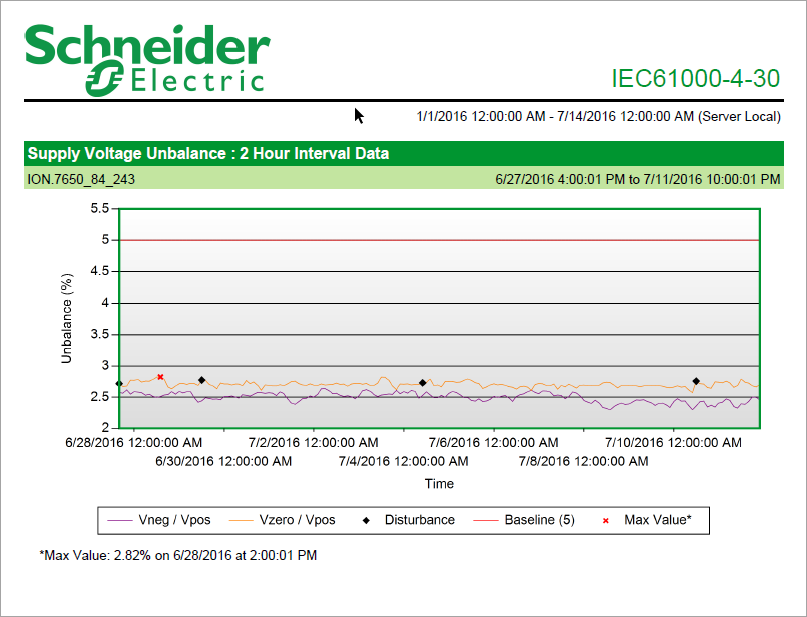
The IEC61000-4-30 Report shows an analysis of power quality relevant measurements that were taken in compliance with the IEC61000-4-30 standard. Use this report for a power quality analysis of your facility based on the IEC61000-4-30 measurement standard.
NOTE: This report needs data from monitoring devices with IEC61000-4-30 monitoring capabilities.
The IEC61000-4-30 report shows the following types of information:
- Voltage profile
- THD profile
- Unbalance profile
- Flicker profile
- Frequency profile
- Summary table
Prerequisites
- The measurement data must be available as historical data logs in the database.
Report Inputs
Type a title for the report in the text box.
Use this input to select the devices you want to include in the report.
Click Select Sources to open the Source Selector dialog. From the Grouping list, select the way in which you want to display the sources (for example by device type, by group name, and so on). Click + and - to expand and collapse items in the navigation tree. Click the check box beside a device (or group of devices) to select it. Click Select All or Select None in the top-right corner to select or clear all the check boxes.
After selecting the devices, click OK.
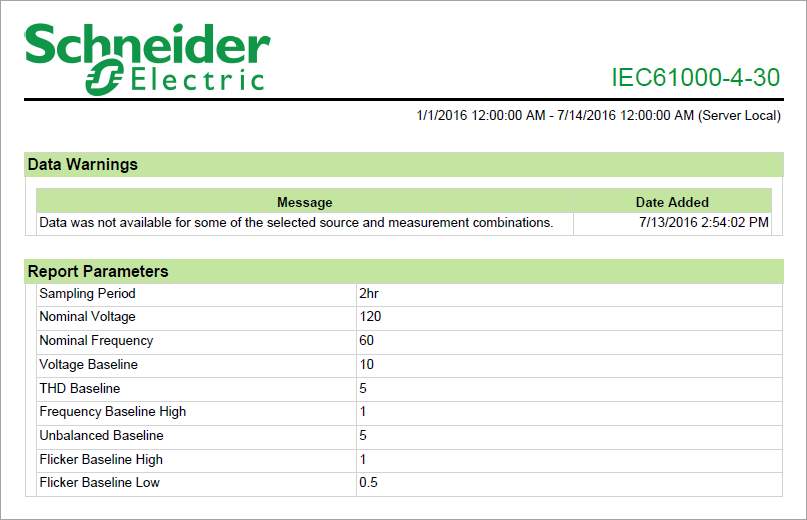
Select the observation period (that is, the measurement interval) of 2 Hour, 10 Minute, or 3 Second to use for the IEC61000-4-30 report.
Type the nominal voltage of the system (for example, 120).
Type the nominal frequency of the system (for example, 60).
Type the Voltage Baseline value if the default percentage is not appropriate for your needs.
Type the THD Baseline value if the default percentage is not appropriate for your needs.
Type the Frequency Baseline value if the default is not appropriate for your needs.
Type the Unbalance Baseline value if the default percentage is not appropriate for your needs.
Type the Flicker Baseline High value if the default is not appropriate for your needs.
Type the Flicker Baseline Low value if the default is not appropriate for your needs.
Use this input to select the timeframe for the data you want to view in the report.
Select the reporting period from the dropdown list. The timeframe options in the timeframe dropdown are relative to the date the report is run. To run a report that starts and ends in the past, select the fixed date option. Type a start and end date in the date boxes or click the arrows beside the dates to display a pop-up calendar and select a date. Type a time in the time boxes or click the up and down arrows beside the time to adjust the hours or minutes up or down. You can also run a report that starts and ends in the future. You must manually add the future data. You can use any tool to generate future data. For example, use Manual Data Editor to manually enter measurement data.
Select the timezone you want to view timestamps in.
Select an option for the format of the label describing the source. The options are Source Name, Source Description, and Combined Name/Description.
NOTE: The source description is the description that was entered in Management Console or Device Manager for a source, when the source was added or edited.
Click Yes to include data warnings in the report. If there are none, the section is not included. Click No to exclude this section.
Example:
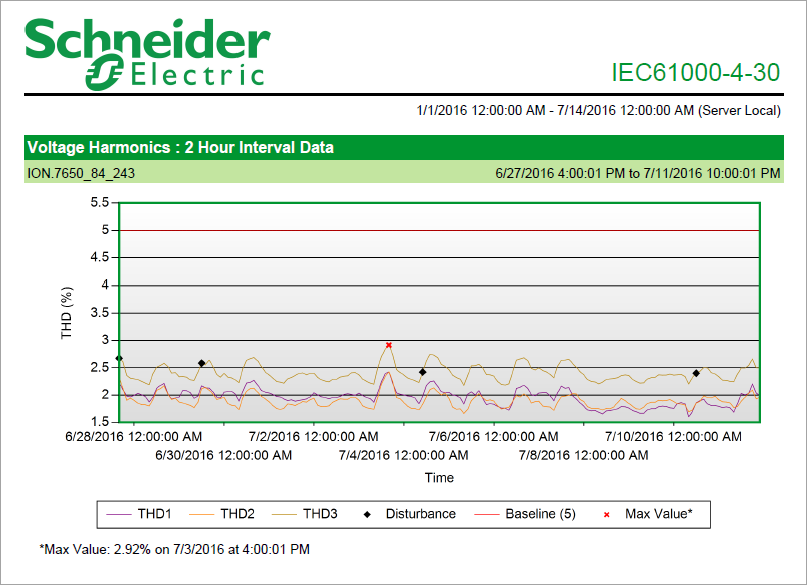
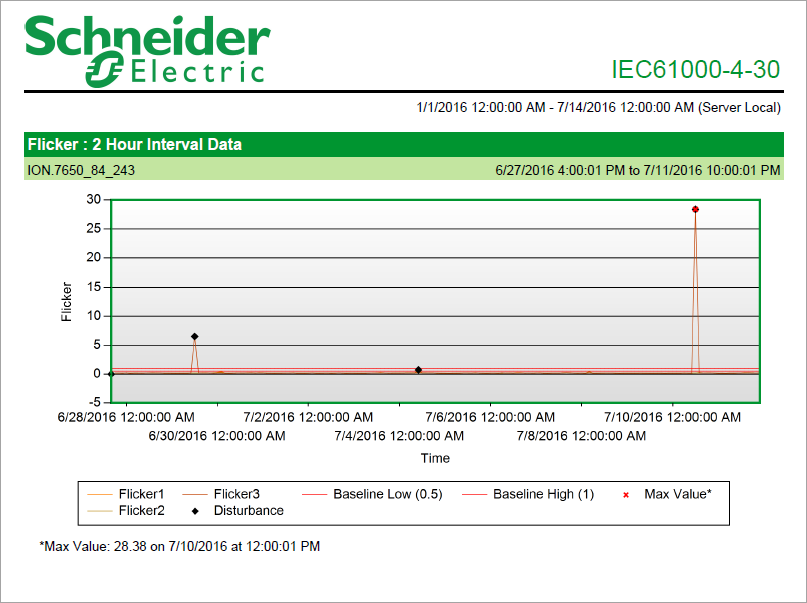
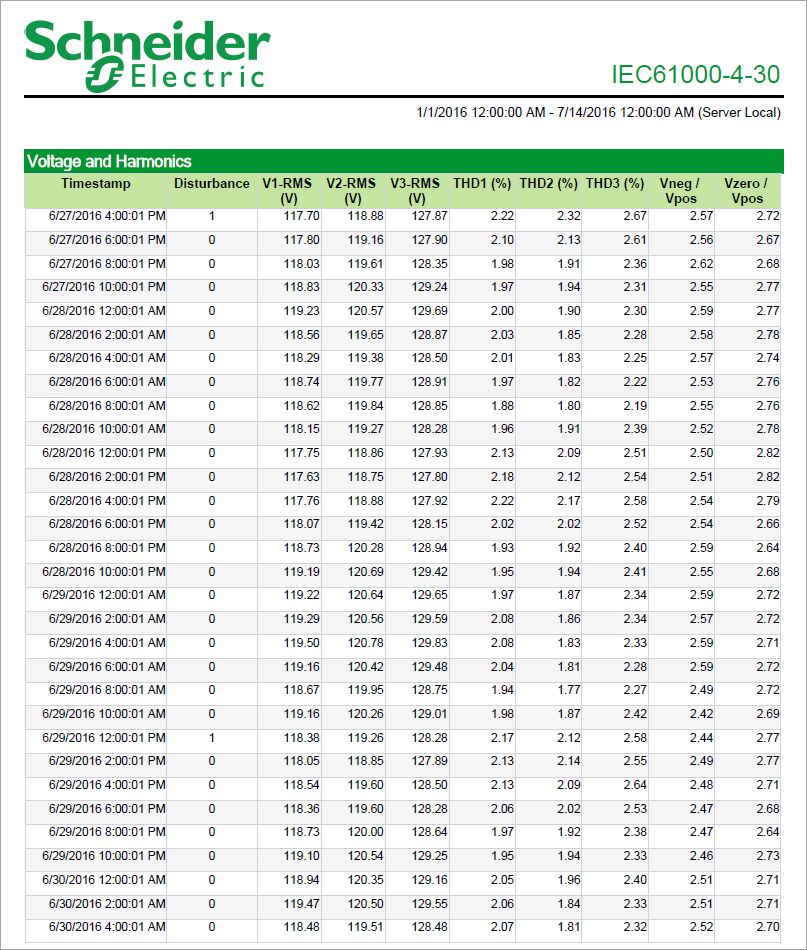
NOTE: This example only shows selected content from the report, it does not show the entire report.