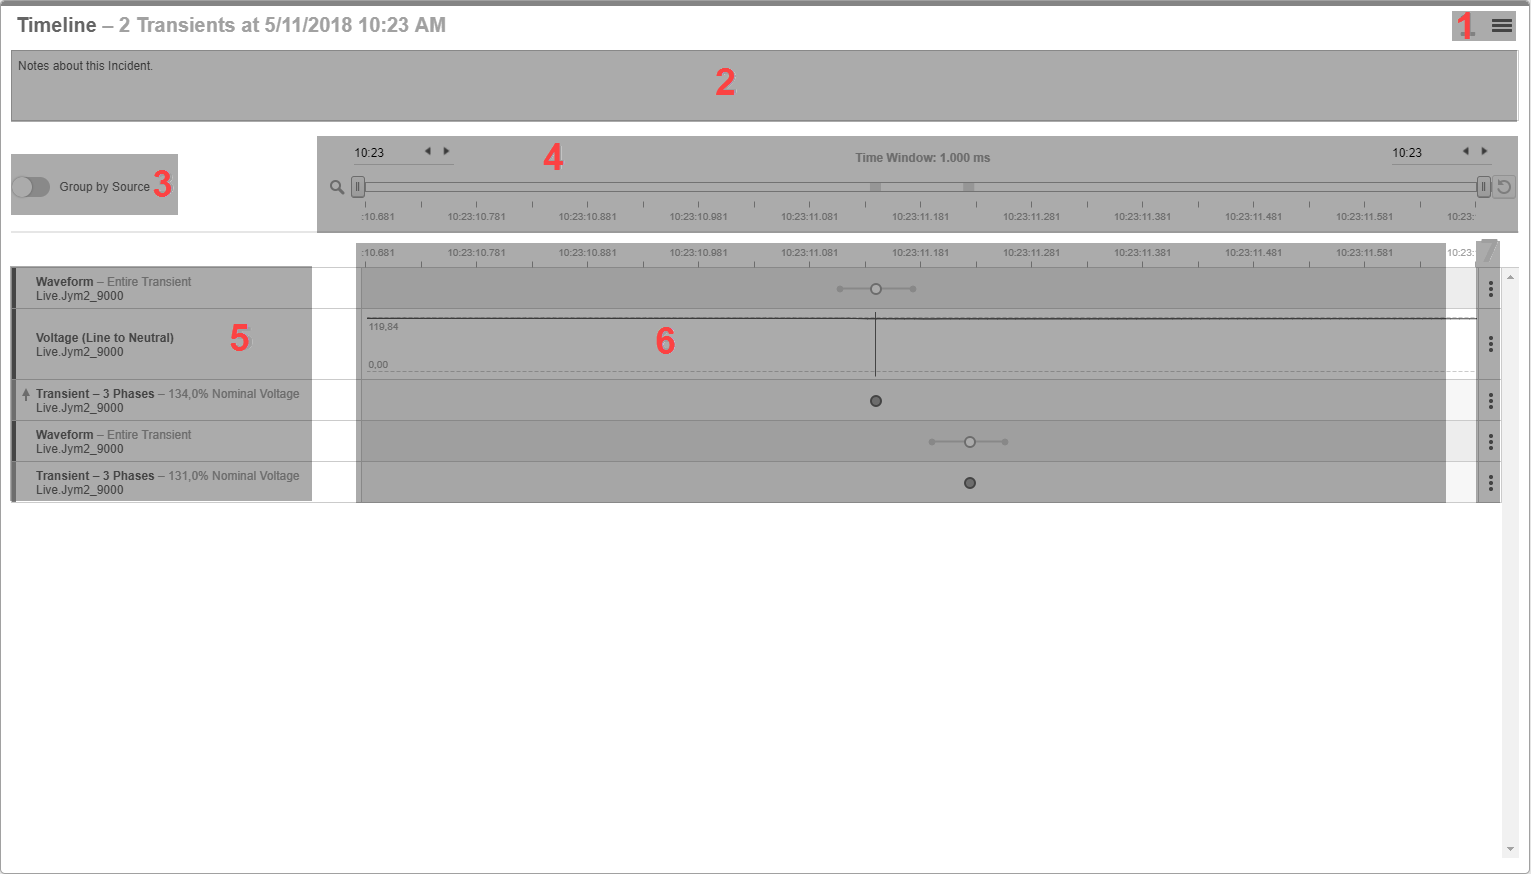
Timeline analysis UI
Analysis UI

NOTE: Alarms and data measurements during an incident occur in very short time intervals. To show the correct sequence of events in the timeline analysis, the timestamps must be accurate. Consider using monitoring devices with Precision Time Protocol (PTP) or GPS time synchronization for accurate time stamping.
| 1 | Options menu
Contains options relevant to the content displayed in the Analysis UI. |
| 2 |
Notes area
|
| 3 | Grouping control
Choose to group the items in the Analysis by time or by source. |
| 4 | Zoom and Heatmap
Use the sliders or the time controls to zoom in or out of the analysis time window. Use the button on the right of the slider to zoom out to the original size. The colored areas act as a heatmap, showing you where the analysis items are located on the time window timeline. |
| 5 |
Analysis items
TIP: Click the item name to open a detail view for the item. |
| 6 |
Timeline
|
| 7 | Analysis item Options
Hide an item from view or choose to open a detail view for an item. |
Timeline analysis view settings UI

| 1 |
View Name
|
| 2 |
Location and sharing
NOTE: A public item is visible to all users in your user group. A private item is visible to you and any user in your user group with Edit permissions on this item type. See Default User Access Level Privileges |
| 3 | Quick Expand
Click this option to extend the time window of the view and adds all devices, and all categories. |
| 4 | Priority filter
Click the priority buttons to include or exclude alarms with that priority. The priorities are, from left to right: No, Low, Medium, High. |
| 5 | Sources selector
Include all sources or select specific sources. |
| 6 | Show control
Show or hide burst data, waveform data, the notes area, spanning alarms, hidden items. NOTE: Spanning alarms are alarms that started before the time window. Hidden items are analysis items that are marked as hidden through the item Options menu. Hidden items appear dimmed when shown. |
| 7 |
Category selectors
|