Advanced Reporting and Dashboards architectures
Several architectures may be considered when integrating Advanced Reporting and Dashboards.
Design considerations
Advanced Reporting and Dashboards (PME) component does not support redundancy. For PME data-acquisition options when using with Power Operation, see Integrating with Advanced Reporting and Dashboards.
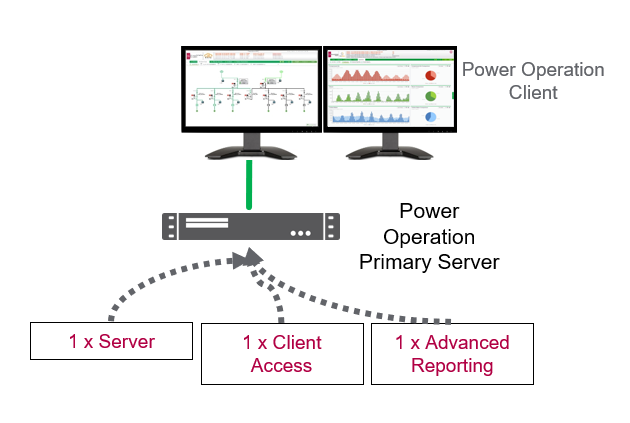
Architecture #1: Simple system without redundancy
The following example architecture illustrates the Advanced Reporting and Dashboards Module in a system with a single Power Operation Server.
The Power Operation Server and Advanced Reporting Module are installed on the same machine. Additionally at least one additional Client Access license is required to enable remote web client access if hosted on the Primary Server machine.
Architecture #2: Large system without redundancy
The following example architecture illustrates the Advanced Reporting and Dashboards Module installed on a separate server from the Power Operation Server.
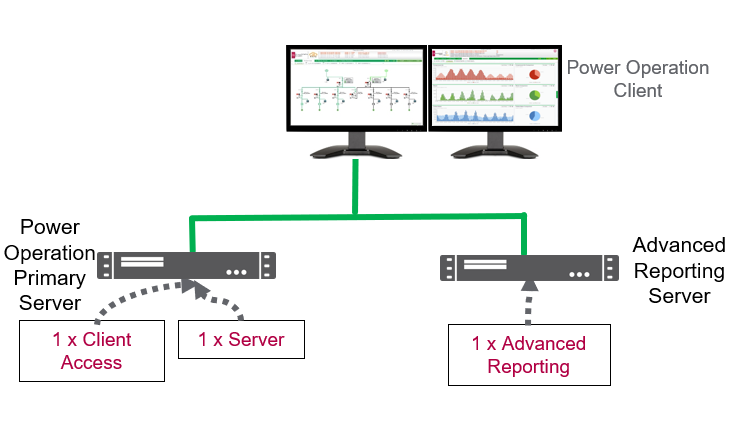
This architecture is typically used for performance reasons. Systems with over 150,000 tags or 600 devices should have Advanced Reporting and Power Operation Server on separate machines.
The Advanced Reporting Server contains both the Advanced Reporting software (PME) and the software key.
Architecture #3: Advanced Reporting with Server redundancy
NOTE: This is the recommended Advanced Reporting architecture.
The following example architecture illustrates the Advanced Reporting and Dashboards Module in a system with Power Operation Server redundancy.
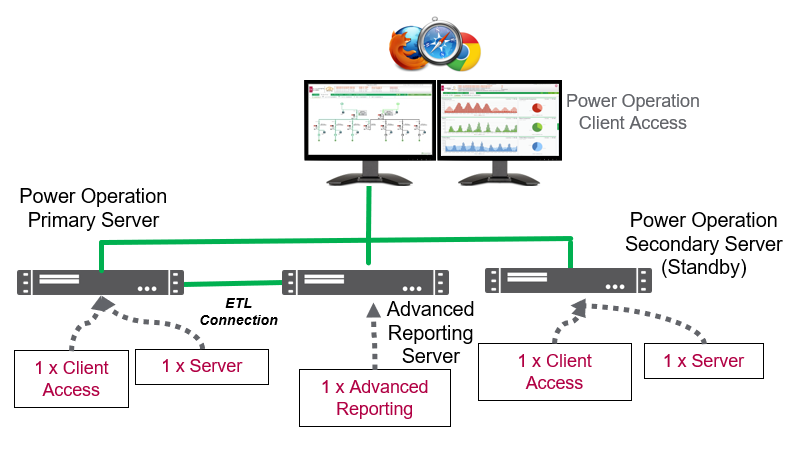
The Advanced Reporting Server contains both the Advanced Reporting software (PME) and the software key.
NOTE: The ETL used to send information from Power Operation to PME is installed on the Advanced Reporting machine.
NOTE: The ETL does not support the concept of communicating with a redundant Power Operation setup. For this reason, if the Power Operation Primary Server failed, then the ETL on the Advanced Reporting Server would need to be reconfigured manually to point to the Secondary Server.
Redundancy Scenario: ETL used for Server redundancy
The following image shows an example where the Primary Server becomes inoperable and the Advanced Reporting ETL is not reconfigured to point to the Secondary Server. In our example, the Primary Server becomes inoperable on June 1 and is restarted on June 3.
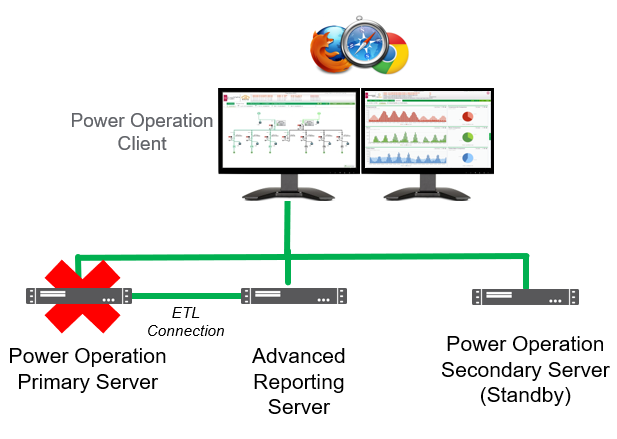
The Secondary Server has taken over the alarming and one-line diagram visualization. Since Advanced Reporting is still running with reports, dashboards, and WebReach diagrams, the functionality of Power Operation and PME would largely remain active from June 1 to 3.
However, when running reports during June 1-3 while the Primary Server is down, reports and dashboard data would NOT be present for this time period. Data previous to June 1 would be present.
Once the Primary Server is recovered on June 3, the Secondary Server will fill the Primary Sever with the missed trend and historical data.
The Advanced Reporting ETL would start pulling data from the Power Operation’s Primary trend file system. Depending on system size, this June 1-3 data would eventually be available in the reports and dashboards.