About the Status tool
Status is a troubleshooting tool available in the Power Operation WebHMI. Status provides insights into your Power Operation system to help you understand how it is organized, monitor performance, and troubleshoot issues. For information on opening the Status tool, see Accessing the Status tool.
System tree
Use the Status tool to view project structure, and a flat list of devices. On the left side of the Status interface, you can use the system tree to examine the various parts of your system.
The following system hierarchy is organized in a tree:
- Cluster
- Machines
- Servers, such as I/O servers, alarm servers, report servers, and trend servers
- Protocols
- Ports
- Devices
You can use the Search bar to filter results in the system tree.
Click a device in the system tree to view data on its status and child devices. For information on the data fields provided by the Status tool, see Status tool data fields.
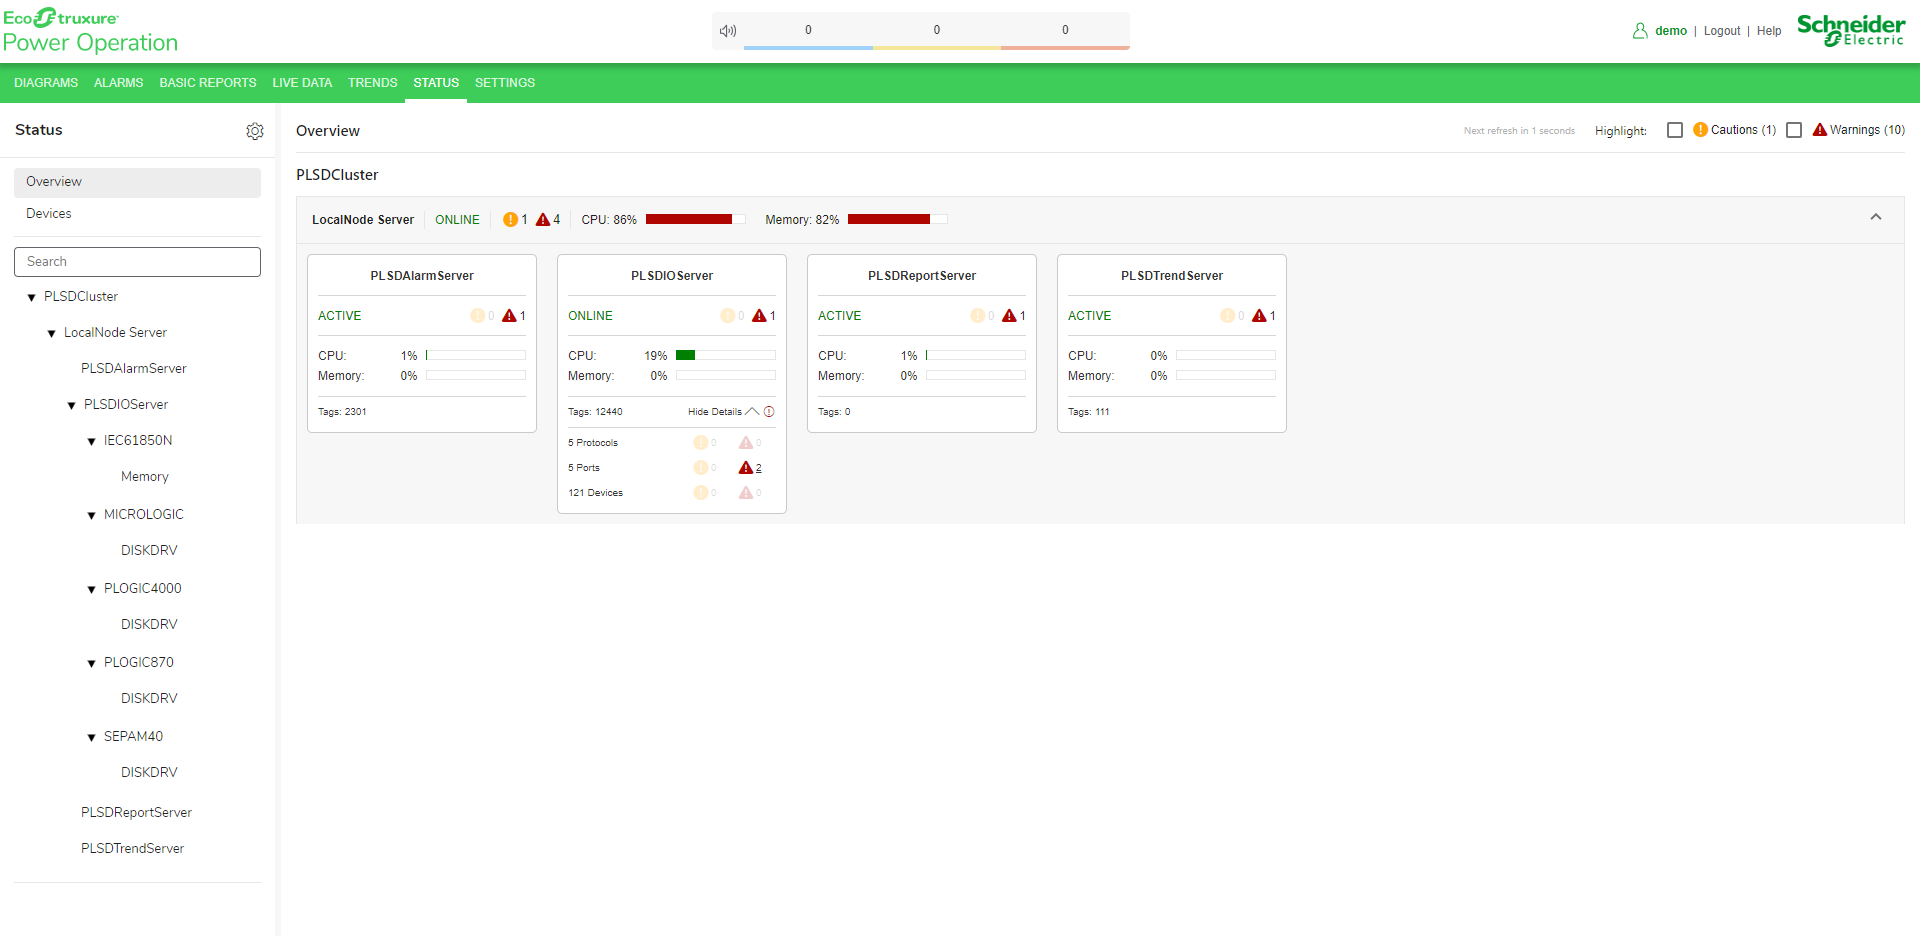
Overview tab
You can use the Overview tab to quickly view the state of your system. You can hover over cautions and warnings to view details.
Devices tab
You can view a device list and associated data on the Devices tab. The Devices tab provides columns of information for each device, such as its cluster, status, protocol ID, and more. You can enable and disable specific columns using the Column Picker dialog, accessed by clicking the button in the top left corner of the Devices tab. You can reorder, sort, and filter the columns.
TIP: Hold down Shift to multi-sort columns.
Cautions and Warnings
You can use Status to identify and address issues that could negatively impact system performance or data integrity. The following best practices can help you get the most out of the Status tool's cautions and warnings:
- Throughout the Status interface, you can mouse over caution and warning icons for a summary of the issues affecting your system.
- On IO server cards, you can click Show Details to view more information on issues that may be present on your system.
- In the top right corner of the Status interface, you can select the Highlight > Cautions or Warnings checkboxes respectively to highlight areas in your system that are being affected by issues.