Equipment Pop-Up Page
The pop-up page displays when you select on a device graphic on a one-line page. This page shows a detailed status for a particular device. Some controls on this page are available only to users with certain privilege levels (see for user access levels).
One of two status pages displays. The page on the left illustrates the status page for a meter genie. The page on the right illustrates the status page for a circuit breaker genie.
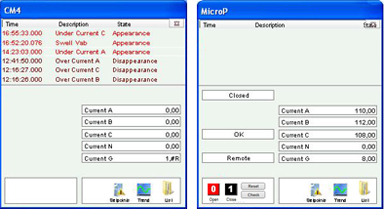
At the top of the page, the most recent alarms and events are listed (racked in/out, Comms Loss, etc.). To view details about an individual alarm or event, right-click the alarm. You can view:
- A waveform. (If you do not see “Waveform” in the list when you right-click the alarm, there are no waveforms for this alarm.) Waveforms can display only if the device is set to “acquire on event,” and the waveform option is checked in the Profile Editor
- the alarm has been acquired at the device, but it has not yet been passed Power Operation
- the device was not set to acquire a waveform, and the waveform option was checked in the Profile Editor
- Details about the device (currents, voltages, powers, resets, others.)
- You can acknowledge or disable the alarm. Acknowledged and disabled alarms are moved to their own sub-tabs.
When the waveform is available for viewing, it displays when you select this link. For information about how the waveform viewer works, see the WaveWeb.pdf file in the Citect bin folder (64-bit example: C:\Program Files (x86)\Schneider Electric\Power Operation\v2024\bin).
Waveforms must be correctly set up before they will display. If there are multiple waveforms, you must select from the list that displays (by default, the waveform search returns all waveform files acquired within the 24 hours prior to the time of the alarm).
When you select the waveform option, and no waveforms are returned, one of two things is likely:
On the left side of the of the status page, status messages display, based on the tags defined for equipment referenced in this genie. The list varies, depending on the device. Possible tags are:
- XCBR1\Pos Position (circuit breakers only)
- XCBR1\CCBRkdPos Racked Out (circuit breakers only)
- XCBR1\CBRkdPos Matching Fault/Trip Circuit Supervision (circuit breakers only)
- XCBR1\Loc Local/Remote (circuit breakers only)
- XCBR1\ESwPos Earth Switch (circuit breakers only)
- PTRC1\Op Tripped
- LPHD1\EEHealth Communication Failure
NOTE: For MicroLogic Type P devices, circuit breaker status fields will display #COM if the device does not have a CCM. Thus, you should not add any tags that refer to the CCM, such as Racked In/Racked Out.
On the right side of the page, real-time values will display for the tag type that you chose in the Value field when you added the genie in the design-time mode. For example, if you enter MMXU1\A\phsA as the value, you will see real-time currents here, as illustrated previous. If you did not enter anything in the Value field when adding the genie, this area will be blank.
At the bottom left corner of the circuit breaker status page, Open, Close, Reset (for circuit breakers).
At the bottom right corner, are the Setpoints, Trend, and List options. See the following sections for descriptions.
Perform IEC 61850 advanced control
To begin using the advanced control feature, select Check in the lower left section of the window.
View waveforms
After you select a waveform for viewing from the genie status page, the external waveform viewer displays it. For instructions on using the tool's analysis feature, see WaveWeb.PDF, located in the Bin folder of the Power Operation 2024 R2 Bin folder (for example: C:\Program Files (x86)\Schneider Electric\Power Operation\v2024\bin
NOTE: Waveforms are not supported on View-only Clients.
Enter setpoints for alarms
NOTE: Any time you change setpoints, you should immediately restart the project. Otherwise, setpoints will not be properly read (they will be truncated and either rounded down or up to a whole integer).
To add setpoints for alarms:
- View the page, then select the genie for which you want to enter setpoints. A status window displays with the name of the genie.
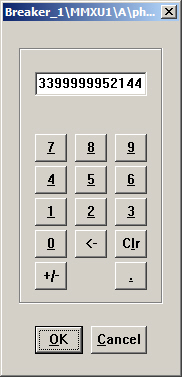
- Select Setpoints, then choose Analog, Digital, or All. When the Alarm Setpoints screen displays, select the first value you want to change. At the “keypad” screen (see below), enter the new value. Select OK to save it. Do this for each setpoint that you want to change.
Based on these setpoints, alarms can begin to display both in the alarms window at the top of the runtime screen and on the Alarms/Events tab (assuming you have set one up for this installation).
When there is a comms loss for a device, the last state before the loss happened is displayed on the screen.
The indication of loss of communications does not filter through the entire bus animation: the downstream part of the drawing may still appear as if communication is working. When any part of a one-line drawing loses communication, do not continue to trust downstream readings until you address the loss of communication.
View real-time trends
This option displays an historical trend. The data that displays is determined by the value that was selected in the Value Type field when this genie was added to the one-line page.
To view a trend:
- From the one-line page in the runtime environment, select a genie to view its status window.
- Select Trend, in the lower right corner. The Analyst screen displays for that trend.
You can select the timeframe for the trend. You can also uncheck phases to remove them from the trend, or highlight a phase to bring it to the front of the trend. For detailed information about the buttons on the screen, select “?” at the top of the page.
View lists of real-time information for the genie
To view lists of real-time currents, voltages; powers; resets and controls; and miscellaneous readings, select List, in the lower right corner, then select an item from the list: Currents, Voltages, Powers, Resets, or Others.
For resets and controls, which are interactive, you should assign users a high level of security. For a list of the default user levels, see User account roles and privileges.
When you select an item from the list, individual tag readings display for that tag type (depending on the tags that you have chosen for this device type). When you select any item in that list, the tag pop-up menu displays with these options: Trend, Override Tag, Control Inhibit Tag, and Tag Status. See Override Tag Status, below, for details.
Override tag status
From the list, you can right-click individual tags and override status settings. To access this feature, the user account must be at least level 4.
Trend: This link lets you view a trend for the tag that you clicked.
Override Tag: You can use this feature to override a real-time value that is incorrect, or to test graphics. Enter the value that you want the system to "read" for this tag in the Override Value line. When you select Apply, the tag is highlighted. When you have finished the test, return to this list to remove the override.
Control Inhibit Tag: When this feature is ON, you will not be able to process writes for this tag. To enable this inhibit, select Apply for this tag from the list. The tag reading is highlighted. To disable this feature, return to the list view of this tag; select Remove.
You can perform control inhibit on an entire device. To do this, you will use the IODeviceControl Cicode function. For more information, see the I/O Device Properties topic in the Plant SCADA help file ( ..\Program Files (x86)\Schneider Electric\Power Operation\v2024\bin\Help\SCADA Help).
Tag Status: This screen views the status of the display value, override status, control inhibit status, and field value. You can also change the override status and control inhibit status on this screen.
Changing background colors: Default colors are assigned for the tag override and control inhibit. Change the default background colors in the parameters, not in the ini file.
To change the color for tag overrides, use OverrideTextBackgroundColor. To change the color for control inhibits, use ControlInhibitTextBackgroundColor. For detailed help, see Page Parameters in the Parameters.chm help file (Start > Programs > Schneider Electric > Power Operation 2024 > Power Operation web-based help).
See also: Viewing Alarms and Events