Setting up Electrical Network Graphics
Use the Building Operation Graphics Editor to create Graphics that represents an electrical network. For example, a one-line Graphic, that includes all of the metering devices and circuits, or an Electrical Health Summary Graphic that shows the loading of the metered circuits in the system.
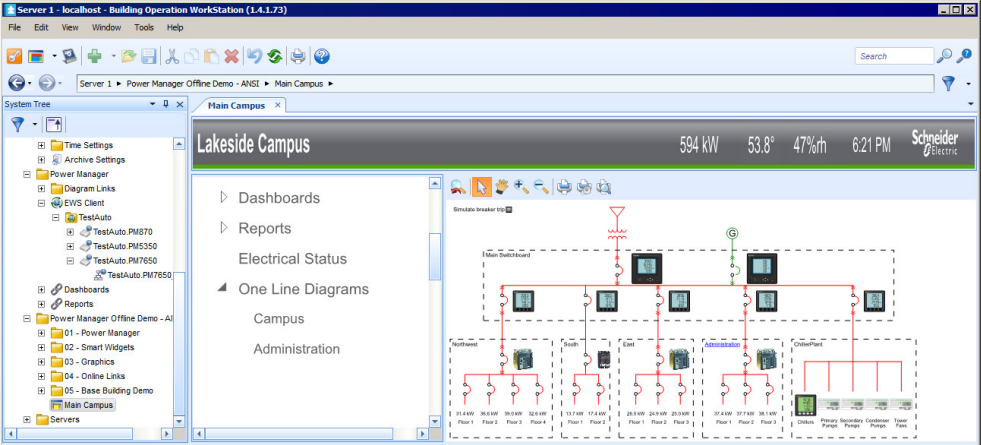
Example of a one-line Graphic, created with the Building Operation Graphics Editor:
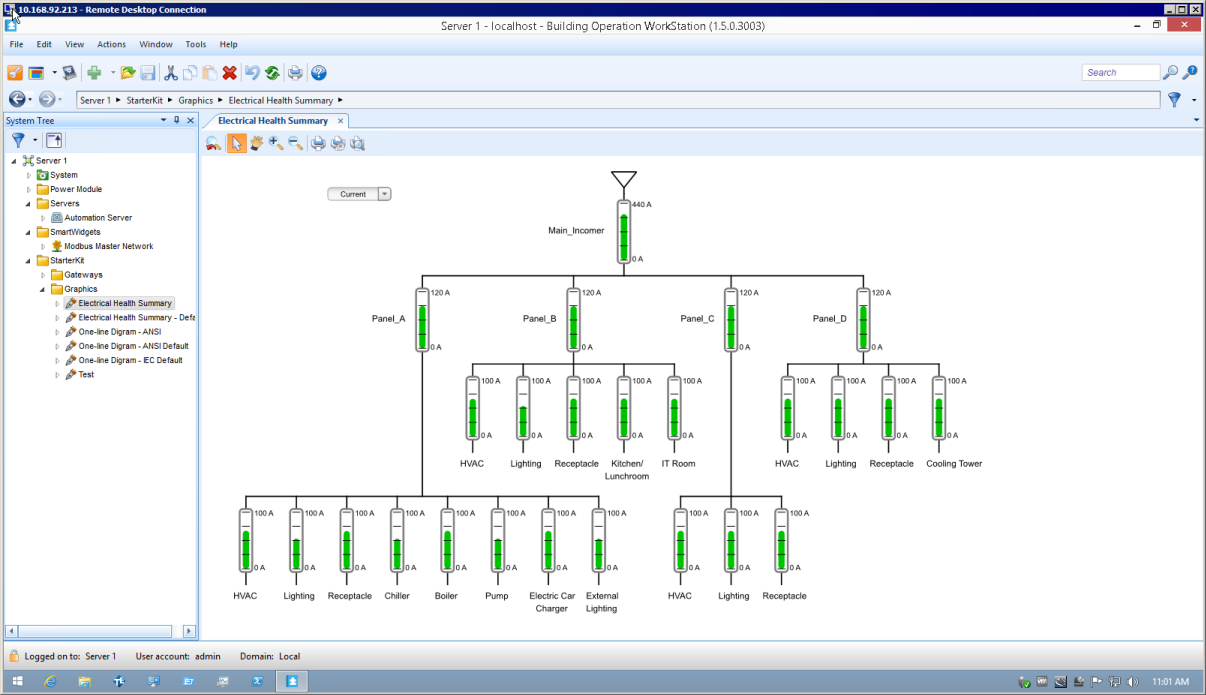
Example of an Electrical Health Summary graphic, created with the Building Operation Graphics Editor:
Basic instructions for setting up Electrical Network Graphics
![]() warning
warning
inaccurate data results
| ● | Do not incorrectly configure the software or the devices. |
| ● | Do not base your maintenance or service actions solely on messages and information displayed by the software. |
| ● | Do not rely solely on software messages and reports to determine if the system is functioning correctly or meeting all applicable standards and requirements. |
| ● | Consider the implications of unanticipated transmission delays or failures of communications links. |
Failure to follow these instructions can result in death, serious injury, equipment damage, or permanent loss of data.
To set up an Electrical Network Graphic:
- Open the Building Operation Graphics Editor.
- Create an electrical network diagram by dragging and dropping graphics onto your new file from the imported graphics libraries (meter graphics, symbols, controls, and so on) in the left pane.
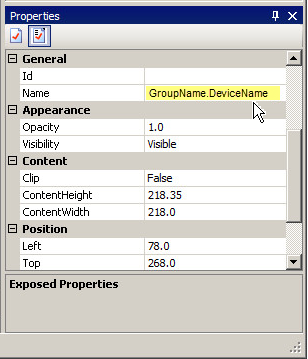
- For the components that you drag and drop into the graphic, select the component, and then modify the component Name, in the General section of the Properties pane. The Name must match the PME “GroupName.DeviceName” or the SmartWidget Name of the device for which you want to display data.
NOTE: This Name is used by the binding template for measurement binding. See Binding Graphics to measurements for details.
For more details on how to use the Graphics Editor, see the EcoStruxure Building Operation Technical Reference Guide and the Building Operation Graphics Editor Web help.