Change Power Quality Indicator thresholds
The Power Quality Indicator threshold for each indicator is displayed on the information page. (Click the “i” icon.)
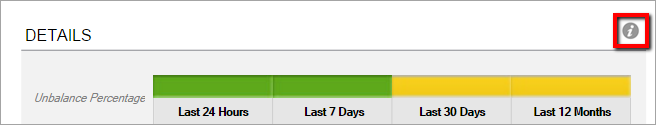
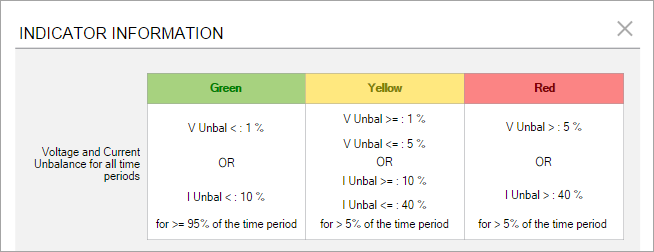
The thresholds are used to determine the Power Quality Rating by using a color (green, orange, red) for each Power Quality indicator. Also, only the samples which exceed the threshold are shown in the Detail Report of the PQ Indicator diagrams.
The count thresholds specified here are used to determine the colors for a year. They get divided by 365 for Last 24 Hours, by 52 for Last 7 Days, and so on. The calculation is as follows:
Round Up ((Yearly Service Limit) x (Number of Days / 365) )
For example, for 30 days, where the yearly limit for orange is 5 and the yearly limit for red is 15:
Orange limit: (5 * (30/365)) = 0.41 which rounds up to 1.
Red limit: (15 * (30/365)) = 1.23 which rounds up to 2.
NOTE: The orange limits are >=, but the red limits are
To change the thresholds:
- In SQL Server Management Studio, in the ION_Network database locate the dbo.vCFG_ConfigItems view.
- Right-click the dbo.vCFG_ConfigItems view and select Edit Top 200 Rows.
The following items are the indicator thresholds:
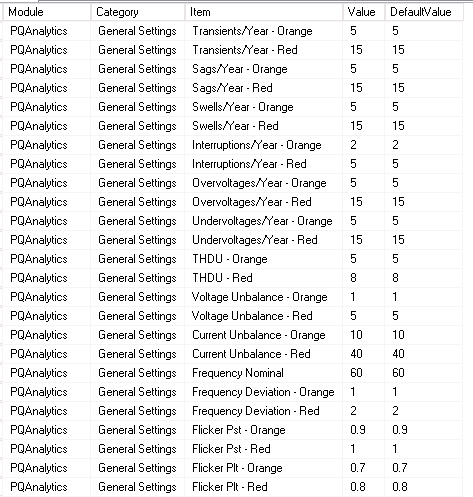
The count thresholds specified here are used to determine the colors for a year. They get divided by 365 for Last 24 Hours, by 52 for Last 7 Days, and so on. The calculation is as follows:
Round Up ((Yearly Service Limit) x (Number of Days / 365) )
For example, for 30 days, where the yearly limit for orange is 5 and the yearly limit for red is 15:
Orange limit: (5 * (30/365)) = 0.41 which rounds up to 1.
Red limit: (15 * (30/365)) = 1.23 which rounds up to 2.
NOTE: The orange limits are >=, but the red limits are >.
- Change the threshold item
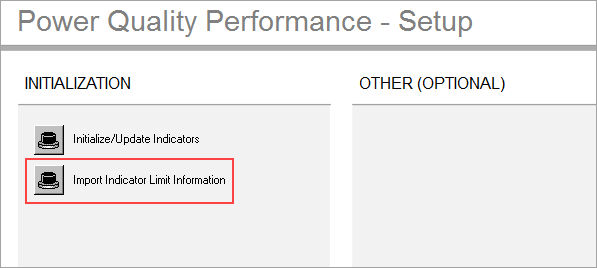
valueas needed. - For the PQ Indicator Diagrams to display the updated limit information, go to the Power Quality Performance Setting page in Vista:

Click Import Indicator Limit Information.