KPI by TOU Report
NOTE: This report is part of the Energy Analysis Reports Module. This module requires a separate license.
Summary
The KPI by TOU Report shows the relative energy consumption for one or more loads based on time of use schedule. Use this report to translate energy consumption into business relevant information that you can use to benchmark and improve your energy productivity.
Details
You can configure the report to send out an email notification if any target values (static or calculated) are exceeded in any of the defined periods.
Prerequisites
- The Energy Analysis Reports Module must be configured.
- The measurement data must be available as historical data logs in the database.
Report inputs
Type a title for the report in the text box.
The Source Selector dialog provides options to show Devices or Views:
Use the Devices option to select the devices you want to include in the report.
From the Grouping list, select the way in which you want to display the sources (for example by device type or by group name). Click + and - to expand and collapse items in the navigation tree. Click the check box beside a device (or group of devices) to select it. Click Select All or Select None in the top-right corner to select or clear all the check boxes.
After selecting the devices, click OK.
Use the Views option to select a hierarchy view (a tree of relationships) or virtual meters. The hierarchy views and virtual meters are configured in the Hierarchy Manager component. (See the Hierarchy Manager Help for further information about hierarchies, virtual meters, and views.) Click + and - to expand and collapse items in the tree. Click the check box beside any hierarchy item in the tree or any virtual meter to select it.
Click OK after making your selections.
Smart Mode is enabled in the Measurement Selector when you select the Views radio button in the Source Selector, which then lets you select a hierarchy view or a virtual meter for your source parameter.
When you open the Measurement Selector, Smart Mode lists general measurement names by default. A Detailed Mode option is also available for the measurements.
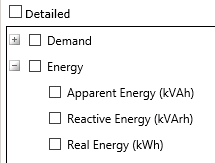
Smart Mode provides a general measurement name for you to select. The measurement is based on a subset derived from all of the available measurements in the particular measurement category. The underlying operation selects an applicable measurement for each device to produce equivalent results for reporting purposes.
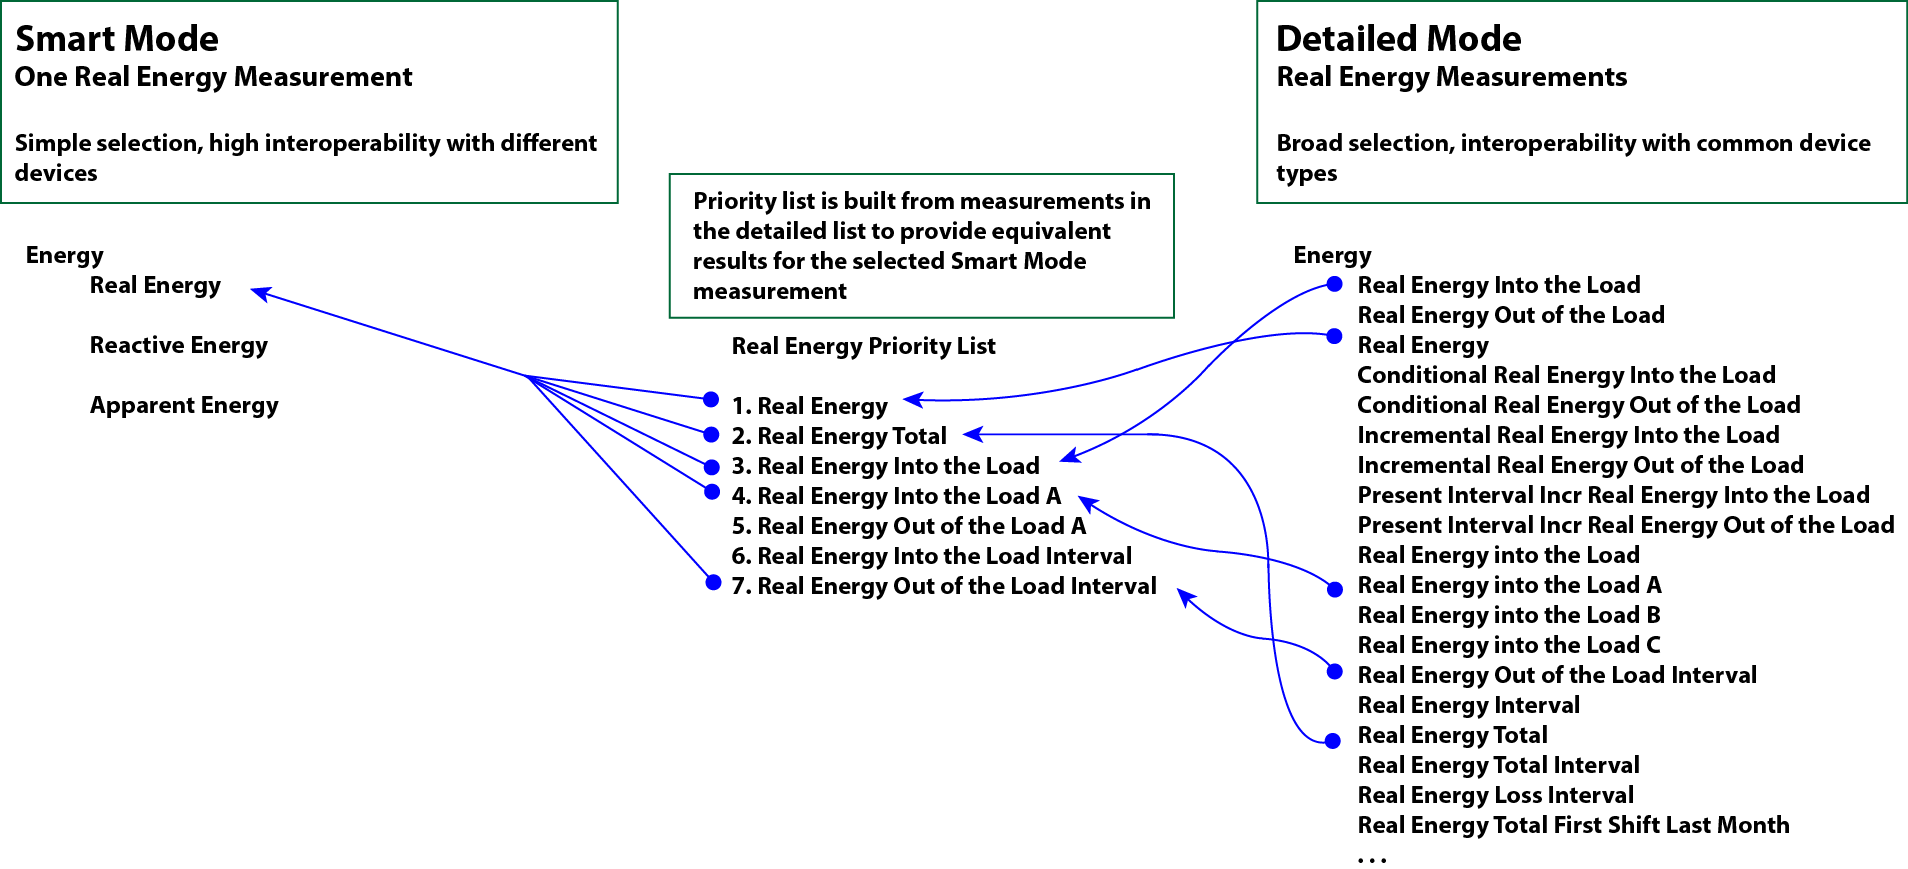
The following image illustrates how measurements in Smart Mode are determined and applied from the priority list of measurements. The priority list contains measurements that usually provide equivalent results for the measurement selected in Smart Mode.
For example, for each device included in a hierarchy view or in a virtual meter, the report starts with the Real Energy measurement in the priority list. If data for that measurement exists, then it is used in the report. If data does not exist for the Real Energy measurement, then the report goes to the Real Energy Total measurement in the list. If data exists for that measurement, then it is used. The report continues to progress through the priority list to select a measurement that pertains to each device associated with a hierarchy view or a virtual meter.
|
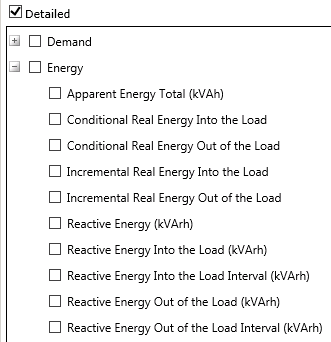
You can select Detailed to change to the detailed selection mode. This mode allows you to select from a full list of measurements.
| Smart Mode | Detailed Mode |
|---|---|
|
|
The Measurement Selector provides a full list of measurements when you select the Devices radio button in the Source Selector.
Click + and - to expand and collapse items in the navigation tree. For reports where you can select multiple measurements, click the check box beside a measurement (or group of measurements) to select it. For reports where you can only select a single measurement, click the measurement name to select it.
After selecting the measurements, click OK.
Enter a value to use as a multiplier in normalizing the raw data in the report. The default is 1.
Enter a value for the target line representing the target for the low end of the energy use. The lower target is a yellow line in the report. Columns in charts that are on lower target line, or between the lower target line and the upper target line, are outlined in yellow. The default value is 0.
Enter a value for the target line representing the target for the high end of your energy use. The upper target is a red line in the report. Columns in charts that on or above the upper target line are outlined in red. The default value is 0.
Select the source as the base against which to scale the main dataset. This input is optional.
Select the measurement as the base against which to scale the main dataset. This input is optional.
Enter a value to use as a multiplier in normalizing the raw data of the scale source and measurements in the report. The default is 1.
Enter the decimal value precision to use in report output and saved values.
Enter any text to be used as the measurement label for instances when normalization is used , for example, kWh/Person. The default is kWh.
Use this input to select the timeframe for the data you want to view in the report.
Select the reporting period from the dropdown list. The timeframe options in the timeframe dropdown are relative to the date the report is run. To run a report that starts and ends in the past, select the fixed date option. Type a start and end date in the date boxes or click the arrows beside the dates to display a pop-up calendar and select a date. Type a time in the time boxes or click the up and down arrows beside the time to adjust the hours or minutes up or down. You can also run a report that starts and ends in the future. You must manually add the future data. You can use any tool to generate future data. For example, use Manual Data Editor to manually enter measurement data.
Select the timezone you want to view timestamps in.
Use this input to select the timeframe, for which standard deviation is calculated. The selected timeframe should be within the reporting period timeframe.
Select the standard deviation calculation period from the dropdown list. The timeframe options in the timeframe dropdown are relative to the date the report is run. To run a report that starts and ends in the past, select the fixed date option. Type a start and end date in the date boxes or click the arrows beside the dates to display a pop-up calendar and select a date. Type a time in the time boxes or click the up and down arrows beside the time to adjust the hours or minutes up or down.
Select the timezone you want to view timestamps in.
Select the aggregation time interval for the reporting data.
NOTE: This note is applicable for KPI report. For the selection of Hourly, Daily, Weekly, or Yearly value for Rollup parameter, the measurement values are always aggregated for the selected measurements based on the interval values. For non-cumulative measurements, it is recommended to select Interval value. For example, if Mean Current measurement is selected and the Rollup is set to Interval, the Mean Current measurements for the selected interval is displayed. If Rollup is set to Hourly, the Mean Current measurement values are displayed as aggregated values and not average values.
NOTE: Interval Rollup is available only for the following reports: KPI reports, Measurement aggregation export report, Measurement aggregation report and Multiple trend report.
Select a TOU schedule to use for the report. Existing time of use schedules are shown in the list. If you have not created a time of use schedule, the field shows that no time of use schedule is available.
Select whether or not to calculate and show in the column chart upper and lower standard deviation lines. The default is No.If multiple sources or multiple Time of Use periods exist, then each source / Time of Use period is represented on a separate chart .
Select whether or not to show an additional line in each chart representing the average of that series in the generated report. The default is No.
Enter a value to adjust the width of the standard deviation banding. The default is 1.
Select one of the available chart types from the dropdown list to graphically display the data that you specified for the report.
Select whether or not to show the data table in the generated report. The default is No.
Select whether or not to scale the chart normally. Selecting No, sets the starting point of the Y-axis at zero. The default is Yes.
Select whether or not to show the zero values, which can not be scaled in the data table of the generated report. The default is No. If a scaling Source and Measurement pair is selected but for some of the rolled up intervals (Aggregation + Time of Use), these values cannot be calculated because of divide by zero error. In this case these values will be set to zero.
Click Yes to include data warnings in the report. If there are none, the section is not included. Click No to exclude this section.
Select whether or not to send out notification emails whenever the calculated value of aggregated interval exceeds the specified static target value. The default is No.
Select a notification option for when to send out notification emails. The available options are:
- Do Not Notify
No notification email will be sent.
- Both Upper and Lower
Send a notification email if the calculated upper and lower line value exceeds the aggregated interval value.
- Upper Only
Send a notification email if the calculated upper line value exceeds the aggregated interval value.
- Lower Only
Send a notification email if the calculated lower line value exceeds the aggregated interval value.
Select whether or not to send out notification emails and show in charts whenever the last aggregated interval exceeds the specified target lines. The default is No. The last interval is the absolute last aggregated interval in the selected reporting period, regardless whether data exists for that period.
Select Yes to show charts which contain any aggregated intervals that exceeds the specified cause target value. If Notify/Show Charts on Last Aggregated Interval Exception Only is set to Yes, only charts which exceeds the target value in the Last interval is shown.
Enter a comma-separated list of email addresses to which notification emails will be sent.
Enter the subject line for the notification emails.
Select an option for the format of the label describing the source. The options are Source Name, Source Description, and Combined Name/Description.
NOTE: The source description is the description that was entered in Management Console or Device Manager for a source, when the source was added or edited.
Example:

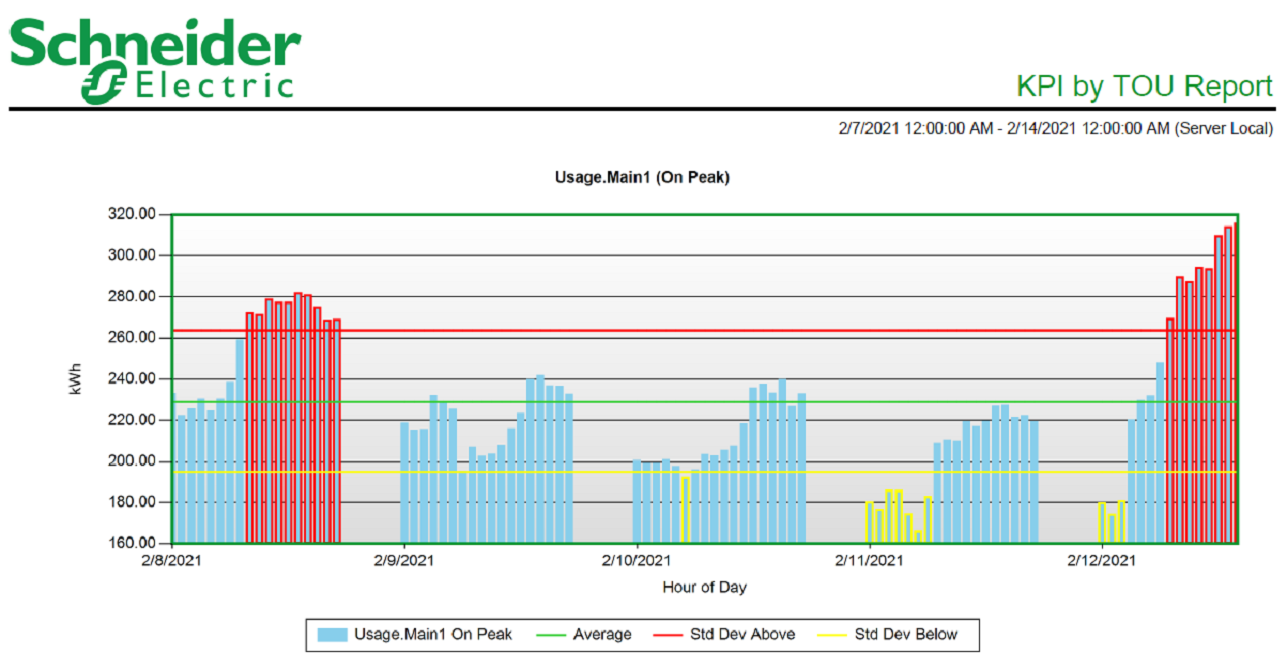
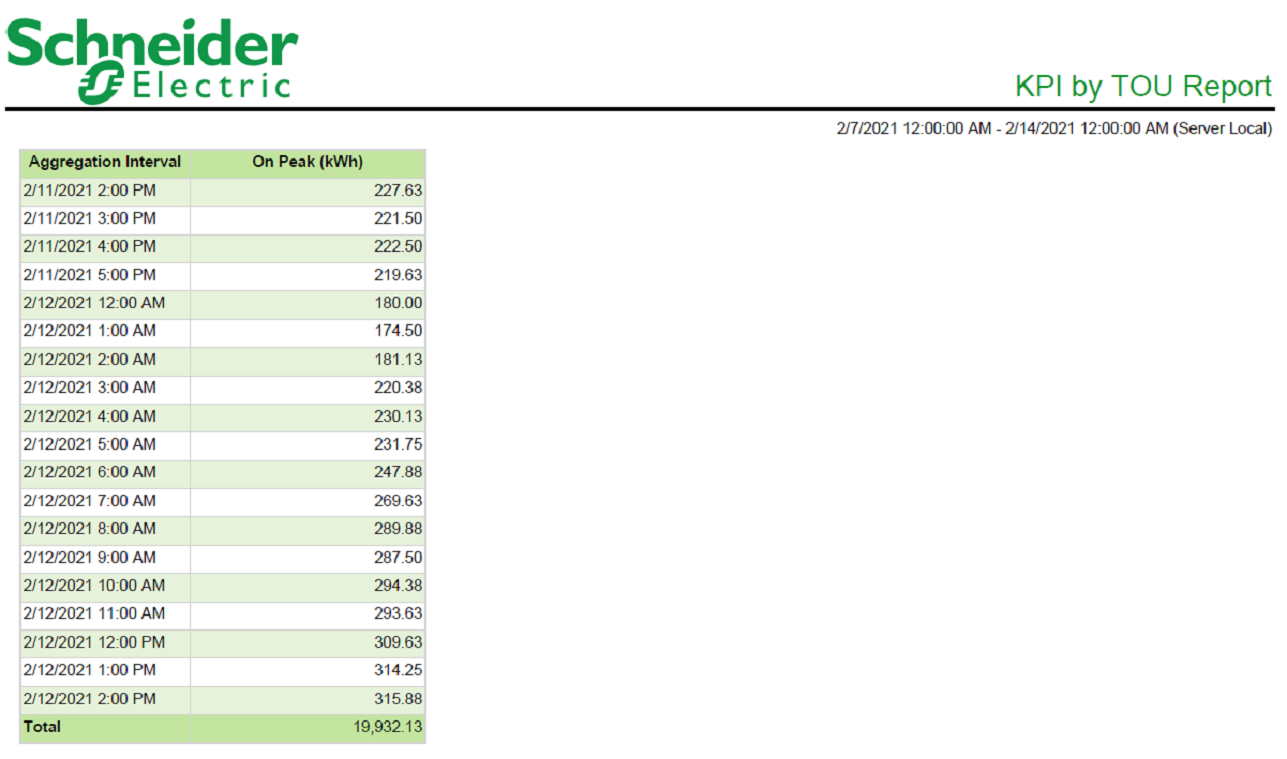
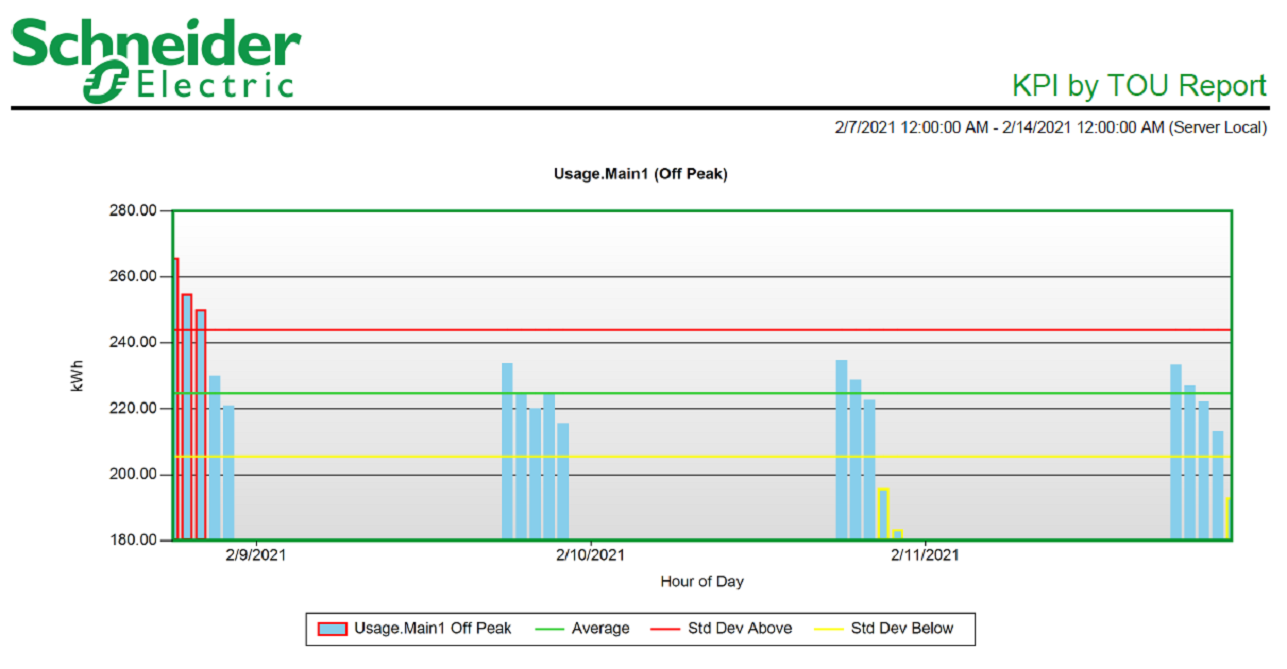
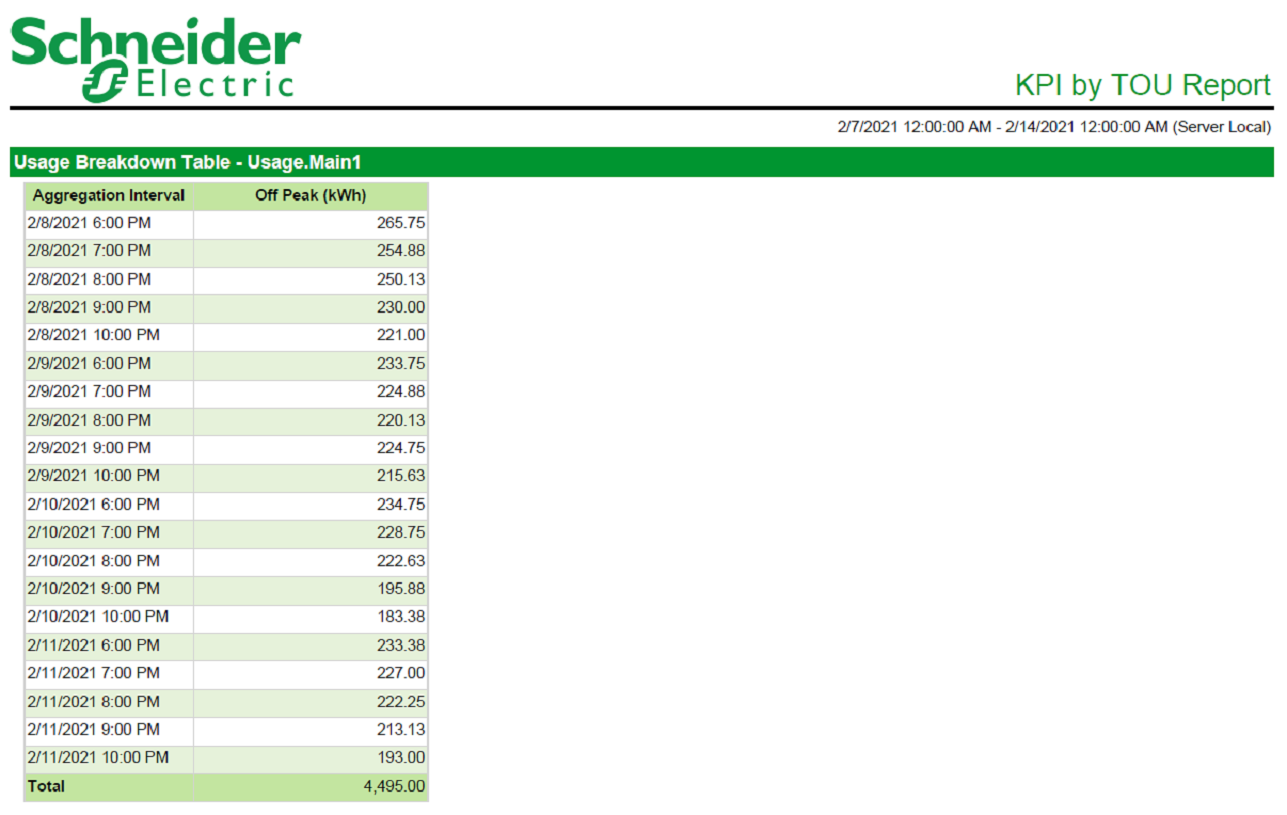
NOTE: This example only shows selected content from the report, it does not show the entire report.