Manual Data Editor user interface
Data editor user interface (UI)

| 1 |
Load New Data.
|
| 2 |
Locate Changes.
|
| 3 |
Locate Issues.
|
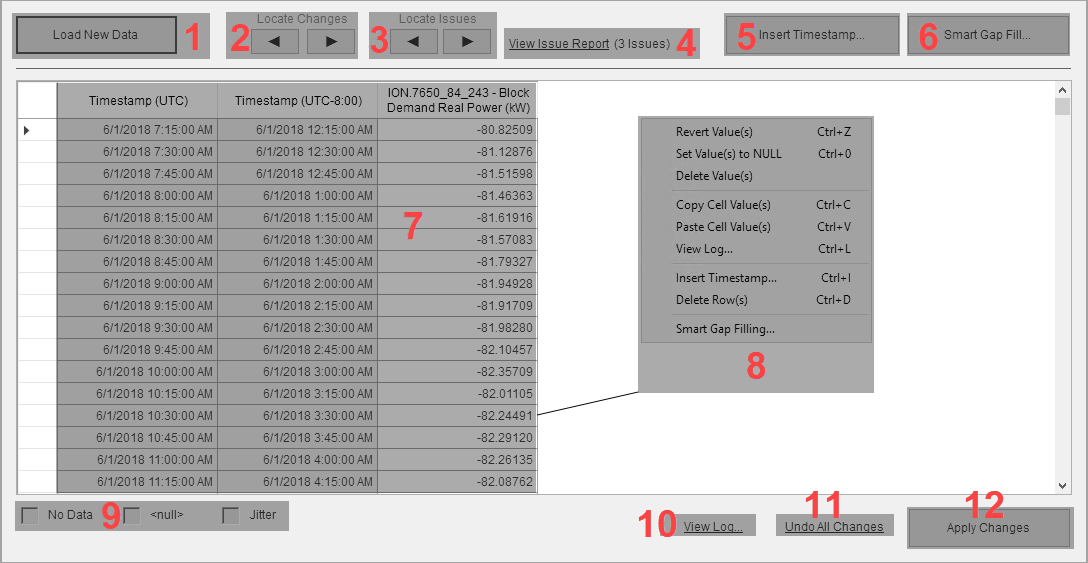
| 4 | View Issue Report.
Use View Issue Report to see which data issues were identified by Manual Data Editor in the data loaded into the data editor. |
| 5 | Insert Timestamp.
Insert a new data record in the data loaded into the data editor with a timestamp you can specify. The timestamp must be in the time range of the data that is loaded into the editor. The new record has <no data> data values. When adding new data records, keep in mind that a historical data log timestamp marks the end of the logging interval. For example, a data log with a 15 minute logging interval and timestamp of 17:00 represents data for the time interval of 16:45 - 17:00. |
| 6 | Smart Gap Fill.
Use Smart Gap Fill to fill in missing data in the data set loaded into the data editor. You can select a range of data that you want to fill the gaps in or you can fill all gaps in the entire loaded data range. When selecting a data range in the editor, only select the data values, not the timestamps. See Smart Gap Fill UI for more information. |
| 7 | Data grid.
The data grid shows the sources/measurements that you specified in the Load Data dialog box. Use the grid and the functions in the data editor to edit the data as needed. TIP: Move the pointer over the header of a data column to see a tooltip with additional information. |
| 8 | Context menu.
Right-click a data cell in the data grid to open the context menu. The Context menu gives you access to the commands and functions for editing the data loaded into the data editor. |
| 9 | Color legend for issues highlight
The data editor uses different color highlights to mark data issues. This legend tells you which colors are used for which type of issues. |
| 10 |
View Log
|
| 11 | Undo All Changes
You can undo changes that have not been applied yet. After changes have been applied to the database, they are permanent and can only be modified be manually editing the data again in the Manual Data Editor. |
| 12 | Apply Changes
After you have completed your data edits, click Apply Changes to write the changes to the database. After changes have been applied to the database, they are permanent and can only be modified be manually editing the data again in the Manual Data Editor. |
Load Data UI

| 1 |
Available Sources.
|
| 2 | Available Measurements.
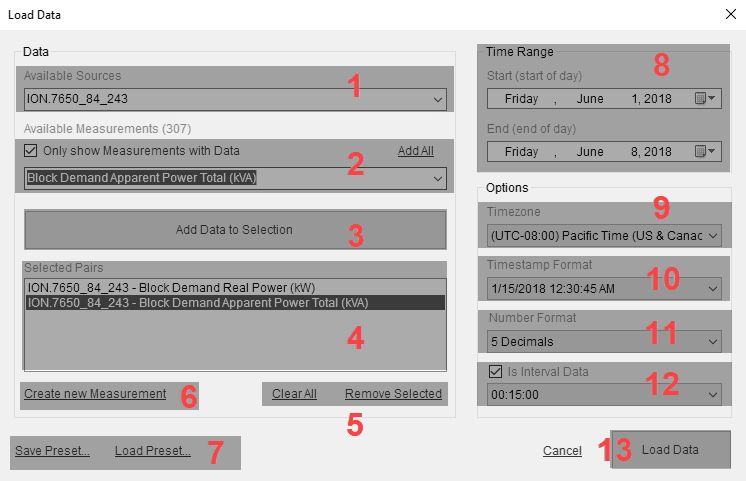
Select the measurement for which you want to load data. You have the option to only see those measurements that have logged data for the selected source in the drop-down control, or see all measurements that are defined in the software. |
| 3 | Add Data to Selection
Click Add Data to Selection to add the source/measurement you selected, to the list of data to be loaded into the data editor. You can add multiple measurements from the same source, and measurements from different sources to the list. |
| 4 | Selected Pairs
This shows the list of selected source/measurement pairs that are to be loaded into the data editor. |
| 5 | Edit commands for the Selected Pairs list
Use Clear All to remove all selected list items. Use Remove Selected to remove items that you selected from the list. |
| 6 | Create new Measurement
Use this to create a new measurement in the software. This function is needed if you want to add data that was manually collected for a measurement that does not exist in the software. For example, if you wanted to add a daily count of cars parked in a parking lot, you could define a measurement called Number of Cars, which doesn't exist in the software by default. Then you can select this measurement and a source in Manual Data Editor and add data records with the daily counts. NOTE: Check the list of available measurements to see if one exists for your application before creating a new measurement. |
| 7 | Preset
Save and load settings for the Load Data dialog box. This is a way to simplify the data selection for data sets that you frequently access. Set all the settings in Load Data for the data sets you want and then save the settings to an external file using Save Preset. Load a pre-defined set of settings into Load Data using Load Preset. |
| 8 | Time Range
Select the time range for which you want to load the data from the sources/measurements. |
| 9 | Timezone
Set the timezone for the display of the configurable timestamp in the data editor. The data editor shows two timestamps for each data record, one timestamp in UTC and one in a configurable timezone. |
| 10 | Timestamp Format
Set the format for the timestamp display in the data editor. |
| 11 | Number Format
Set the number of decimals that are displayed for the logged data in the data editor. NOTE: This setting only affects the display of the data in the data editor and the accuracy to which you can enter new data values. It does not affect data that is loaded into the editor and then applied to the database without editing the values. |
| 12 | Is Interval Data
Set the expected logging interval for the data. This setting ensures that there is a data row in the editor for every expected log entry. If there is no data record for an expected entry in the database, then the Manual Data Editor inserts a timestamped row with a <no data> data values in the editor. This makes it easier to identify missing records and correct them. NOTE: The data editor shows all logged records in the selected time range, regardless of the Interval Data settings. No records are hidden or filtered out. |
| 13 | Load Data
Click Load Data to open the selected sources/measurements data in the data editor. |
Audit Log UI

| 1 |
Data.
|
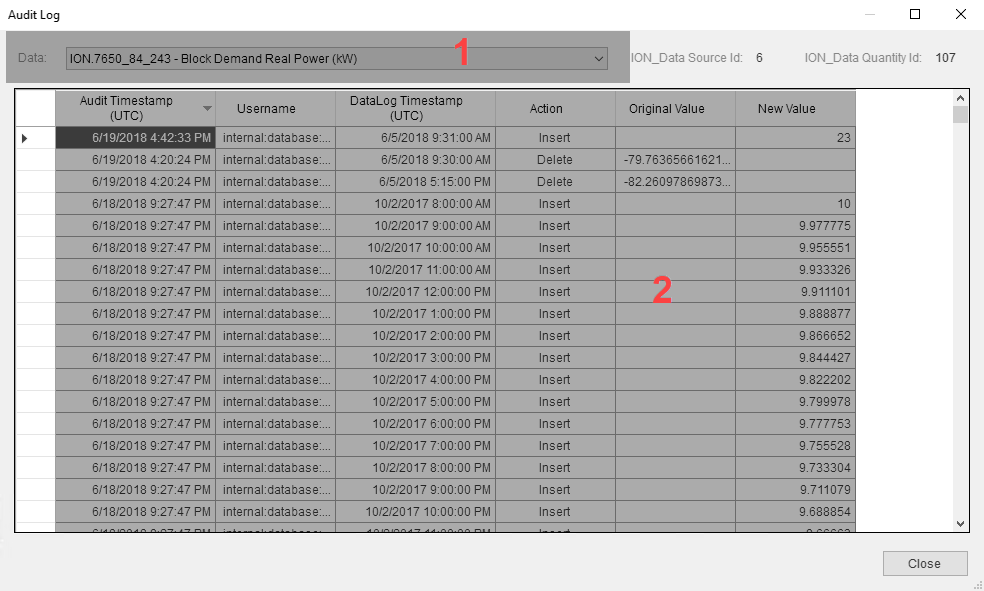
| 2 | Audit log.
View the change history for edited data records including timestamp, username, action, original value, new value. You can use the information in the audit log to reset data values to their original value if they were changed accidentally or incorrectly. |
Smart Gap Fill UI

| 1 |
Time Range.
|
||||||
| 2 | Data.
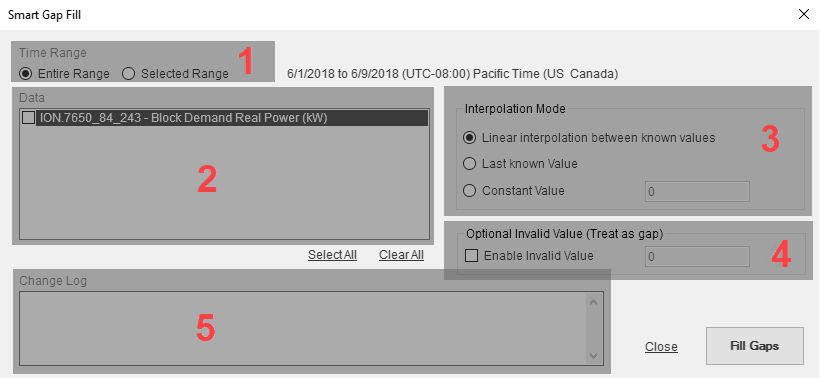
This is a list of all the sources/measurements that are loaded into the editor. Select the source/measurement pairs for which you want to fill gaps. |
||||||
| 3 |
Interpolation Mode
|
||||||
| 4 | Optional Invalid Value
You can define a data value that is treated by the gap fill algorithm as if it was a gap. For example, if you define 0 (zero) as the Invalid Value, then any data record in the Smart Gap Fill range that has a value of 0 is treated as if it was a gap. |
||||||
| 5 | Change Log
The Change Log shows how many gaps were filled, for each of the selected source/measurement pairs, after you click Fill Gaps. NOTE: This is different from the Manual Data Editor audit log. The audit log records changes that are applied to the data in the database. The Change Log shows which gaps where filled in the data editor. |