Power Quality Performance events and disturbances
Events
Power Quality (PQ) events are short-term disturbances that are characterized by magnitude, duration, and direction.
The following table provides definitions for the different PQ events:
|
PQ Events |
Summary |
Magnitude |
Source |
Duration |
Consequence |
|---|---|---|---|---|---|
|
Interruptions |
Loss of the supply voltage |
Less than 10% of nominal |
Utility or facility |
½ cycle to 1 minute or more |
Downtime |
|
Voltage Sag |
Decrease in voltage magnitude |
90% to 10% of nominal voltage (typical) |
Utility or large motors starting |
½ cycle to 1 minute |
Malfunction or downtime |
|
Voltage Swell |
Increase in voltage magnitude |
110% to 180% of nominal (typical) |
Utility or facility |
½ cycle to 1 minute |
Equipment malfunction or damage |
|
Transient Voltage |
Short-duration high overvoltage |
Potentially several thousands of volts and amps |
Switching activities or lightning strikes |
<50 ns to 50 ms |
Electronic equipment damage |
|
Over Voltage |
Sustained increase in voltage magnitude |
110% to 120% of nominal (typical) |
Utility or facility |
More than 1 minute |
Equipment malfunction or motor heating |
|
Under Voltage |
Sustained decrease in voltage magnitude |
80% to 90% of nominal (typical) |
Utility or facility |
More than 1 minute |
Equipment malfunction or damage |
Power Quality event classifications
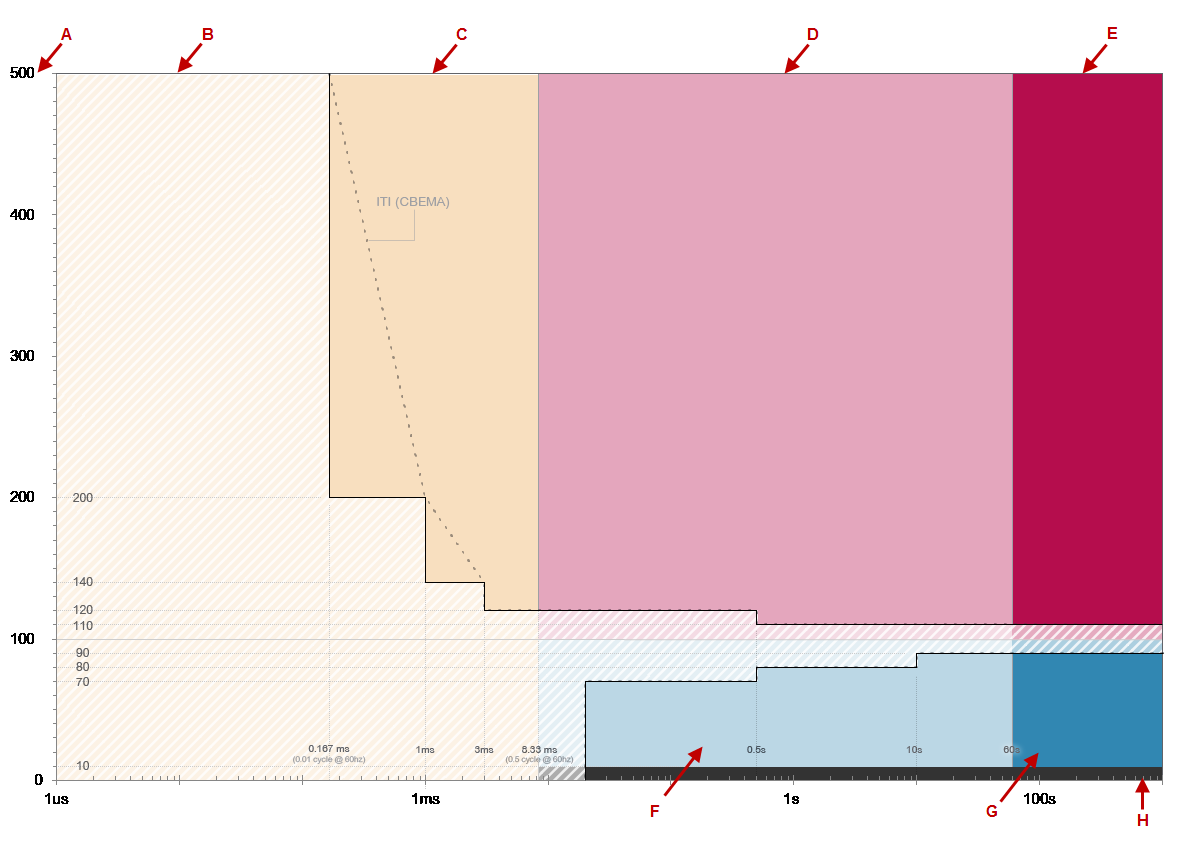
The following image illustrates the classification of events in relation to a CBEMA chart. The Power Quality Performance gadgets and reports follow this same color classification of Power Quality Events.

| A | Percent of nominal voltage | B | No impact region | C | Transient | D | Swell |
| E | Over Voltage | F | Sag | G | Under Voltage | H | Interruption |
Disturbances
Power Quality (PQ) disturbances are long-term disturbances.
The following table provides definitions for the different PQ disturbances:
|
PQ Disturbances |
Summary |
Magnitude |
Source |
Duration |
Consequence |
|---|---|---|---|---|---|
|
Voltage Unbalance |
Non-symmetrical voltages |
0.5% - 2.5% of nominal voltage (typical) |
Utility or facility |
Steady state |
Overheating or malfunction |
|
Current Unbalance |
Non-symmetrical current |
1.0% - 30% of nominal current (typical) |
Utility or facility |
Steady state |
Malfunction and breaker trip |
|
Voltage Harmonics |
Waveform distortion |
0 to 20% (typical) |
Nonlinear loads |
Steady state |
Malfunction and overheating |
|
Current Harmonics |
Waveform distortion |
0 to 20% (typical) |
Nonlinear loads |
Steady state |
Malfunction and breaker trip |
|
Frequency Variation |
Deviation of the frequency from the nominal |
Up to 5% deviation of nominal (typical) |
Standby generators or poor power infrastructure |
Intermittent |
Malfunction or motor degradation |
|
Flicker |
Voltage waveform envelope variations |
0.1% to 7% (typical) |
Load exhibits significant current variations |
Intermittent |
Flickering lights, equipment malfunction |