Dashboards user interface (UI)
Main UI

| 1 | Dashboard Library
Contains all the Dashboards that are configured in the system. Dashboards can be listed individually, or they can be organized within folders. TIP: To hide the library, click the Hide Library icon ( |
| 2 | Dashboards display pane
Shows the Dashboard selected in the View Library. |
Gadget Settings UI
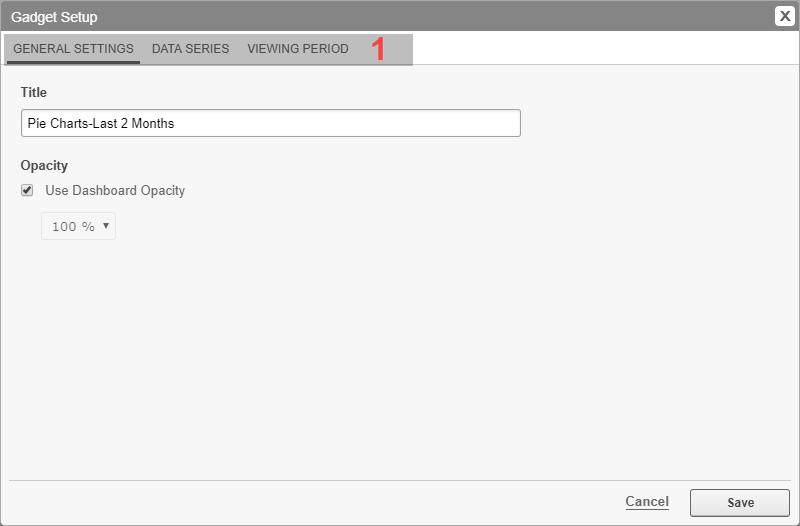
| 1 | Gadget settings tabs
The tabs group the different setting options for the gadget. Different gadget types can have different settings tabs and different settings options within those tabs. |
Dashboard Settings
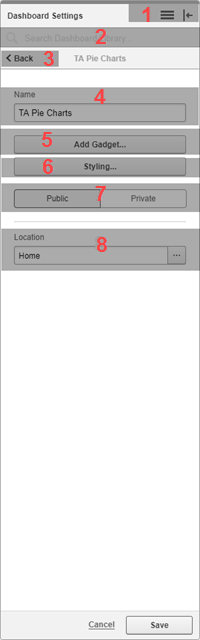
| 1 | Options menu
Contains options relevant to the Dashboard Library. The following options are available: Add Dashboard Add Folder Slideshow Manager |
| 2 | Search filter.
Enter text to search and filter the Dashboards displayed in the Library. |
| 3 | Back button.
Exit the Dashboard Settings and go back to the Library. |
| 4 | Dashboard Name.
Set the name of the Dashboard in the Library. |
| 5 | Add Gadget.
Add new gadgets to the Dashboard. See Adding a gadget to a dashboard for more information. |
| 6 | Styling.
Set the appearance of the Dashboard by adding a background image, setting the background color, and setting the gadget opacity. See Styling a dashboard for more information. |
| 7 |
View Access Permissions selector.
NOTE: A public item is visible to all users in your user group. A private item is visible to you and any user in your user group with Edit permissions on this item type. See Default User Access Level Privileges |
| 8 | Location.
Determine where the Dashboard is stored in the Library. |
Gadget UI
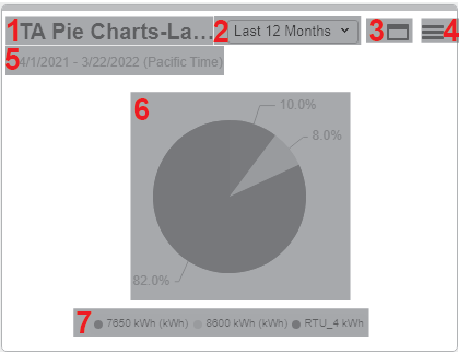
| 1 | Gadget Title
Shows the gadget title. |
| 2 | Viewing Period
Select the date and time range for the data that is to be displayed in the gadget. To view a gadget that starts and ends in the past, select the fixed date option. Type a start and end date in the date boxes or click the arrows beside the dates to display a pop-up calendar and select a date. Type a time in the time boxes or click the up and down arrows beside the time to adjust the hours or minutes up or down. You can also view a gadget that starts and ends in the future. You can use any tool to generate future data. For example, use Manual Data Editor to manually enter measurement data. |
| 3 | Maximize Icon
Select to maximize the gadget to display in full screen of the dashboards display pane. |
| 4 | Options menu
Contains options relevant to the Gadget. The following options are available: Edit Duplicate Copy to Export to CSV Delete |
| 5 | Date and Time Range
Displays the date and time range of the data displayed in the gadget. This display is depended on the selection of viewing period. |
| 6 | Gadget Data
Displays the data of the gadget. Different gadget types can have different data displayed. |
| 7 | Gadget Data Legend
Displays the data legend of the gadget. Different gadget types can have different data legend displayed. |