Communication Performance
The following shows the results of an EWS server performance test in PME:
Computer Type: Server
OS: Windows Server 2019 Standard
SQL: 2019 Standard
CPU: Xeon E5-2680 v3 @ 2.5 GHz
RAM: 64 GB
HDD: 2 x 250 GB 7.2k SATA 6Gbps, 2 x 1 TB 7.2k SATA 6Gbps, 4 x 1 TB 7.2k SATA 6Gbps, 4 x 1 TB 7.2k SATA 6Gbps, 2 x 146 GB 15k SAS 6Gbps
SSD: 446 GB SAS 6Gbps
Software: PME 2022 + EBO 2022
| Number of Devices | Total Number of Tags | Average Response Time (s) |
|---|---|---|
| 5 | 50 | 0.2 |
| 10 | 100 | 0.4 |
| 50 | 500 | 0.7 |
| 100 | 1000 | 1.2 |
| 200 | 1000 | 1.2 |
| 200 | 2000 | 1.7 |
| 500 | 3000 | 2.5 |
| 1000 | 3000 | 2.5 |
| 1000 | 4000 | 3.4 |
| 1500 | 4000 | 3.6 |
| 1500 | 5000 | 4.3 |
| 2000 | 5000 | 4.5 |
| 2000 | 6000 | 6.6 |
| 2500 | 6000 | 6.7 |
| 2500 | 8000 | 9.8 |
| 2500 | 10000 | 13.5 |
NOTE: The EWS response time is independent of the measurement and device type, as long as the number of measurements, and the number of devices they were distributed across, remains the same.
The chart below shows a graphical representation of the EWS response time vs. Number of tags in an EWS request:
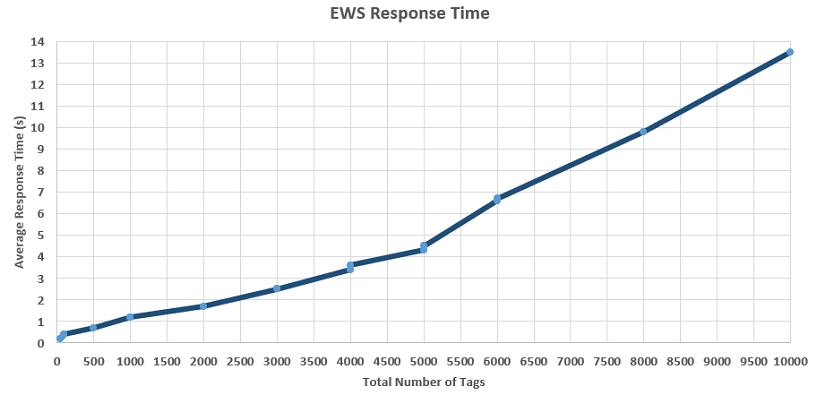
As discussed previously, the EWS request is sent from Building Operation only when there is a need, for example a graphic is open. Therefore, typically an EWS request from Building Operation to PME contains less than 1000 tags. For example, if 100 devices are shown in one graphic, and each has four bound values, then an EWS request for the 400 values (tags) is sent to the PME EWS Server when the graphic is opened in Building Operation. In case, based on the above test results, the EWS response time is about three seconds. This provides plenty of buffer time with a 20 second value polling setting in Building Operation as the default.
NOTE: Consider the impact on other parts of the Building Operation system, when tuning the polling rate to achieve faster refresh.