Set up Power Quality Detail Dashboards
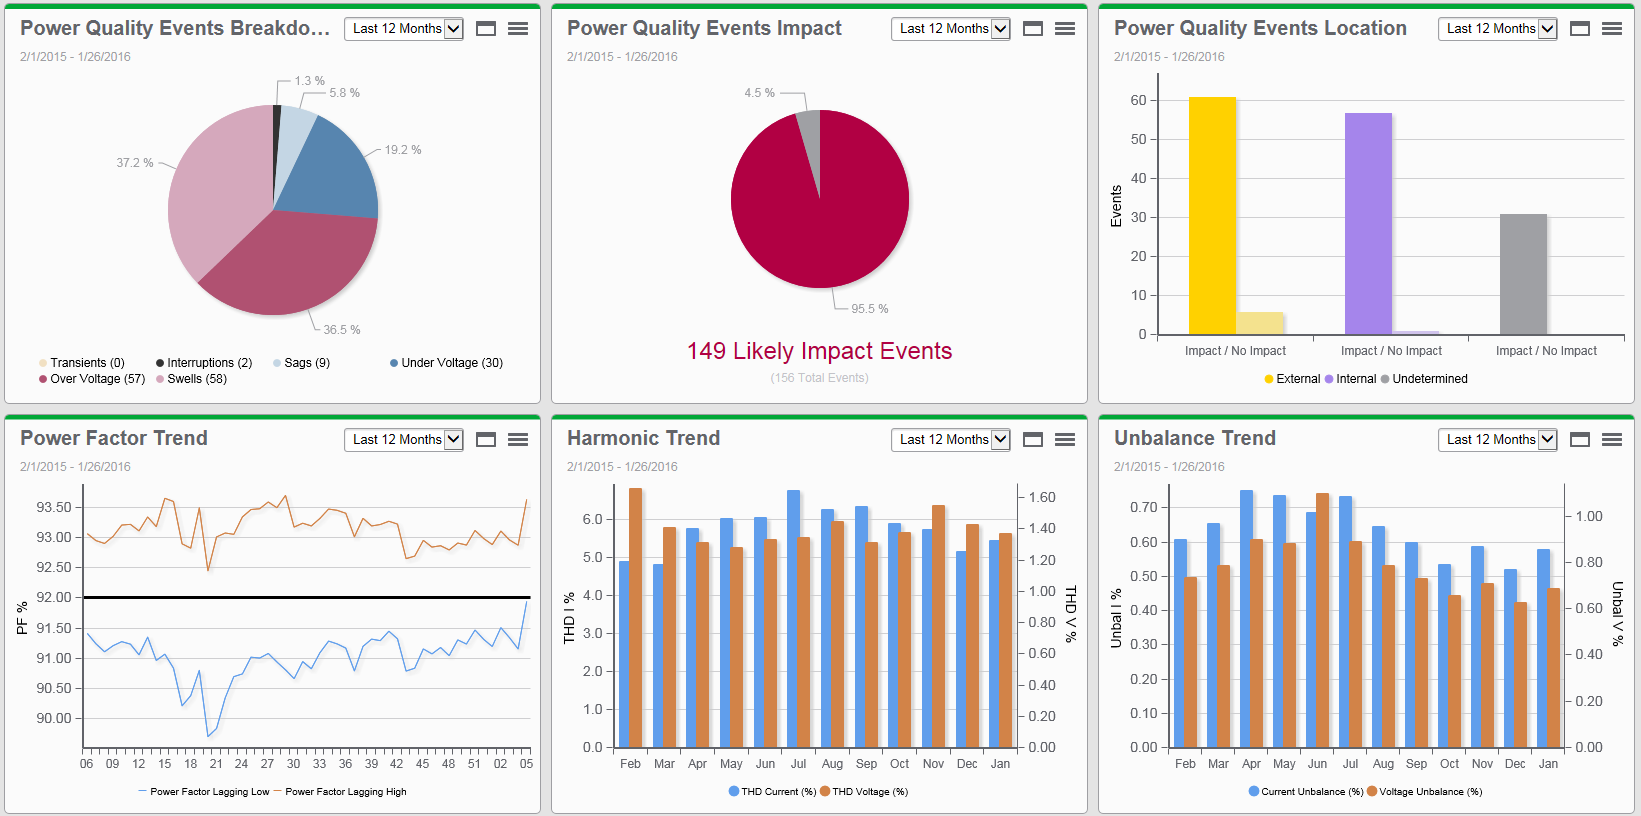
The following image is an example of the Power Quality Detail dashboard. (Three regular Trend charts for Power Factor, Harmonics, and Unbalance are combined in this dashboard.)
The following image is an example of the Power Quality Detail dashboard. (Three regular Trend charts for Power Factor, Harmonics, and Unbalance are combined in this dashboard.)
Last updated: Tuesday January 09, 2024
© 2025 Schneider Electric. All Rights Reserved. Safety Precautions | Feedback | Home | Disclaimer | SE Community