NOTE: This gadget is part of the Power Quality Performance Module. This Module requires a separate license.
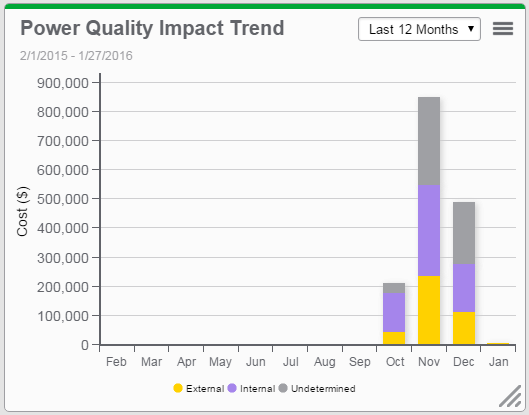
This gadget shows the aggregated cost of power quality events with a process impact, over a selected time period. The information is shown in a stacked column chart, grouped by aggregation period. The location of power quality event origin (external, internal, undetermined) is shown by the color of the columns.
Example:

TIP: Place your pointer on a column in the chart to open a tooltip showing the event origin, cost, and duration. Click a series in the legend to hide or show this series in the chart.
For information about configuring Power Quality gadgets, see Configuring Gadgets.