NOTE: This gadget is part of the Power Quality Performance Module. This Module requires a separate license.
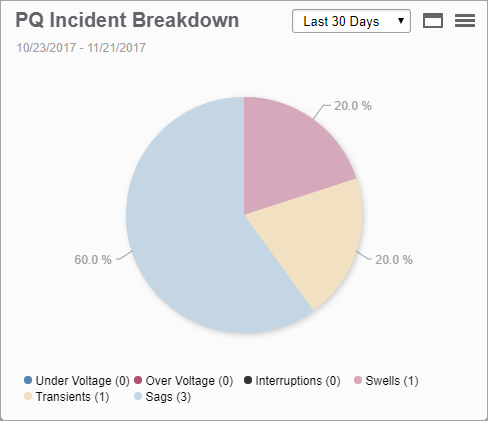
This gadget shows a breakdown of the power quality events, by type, over a selected time period. The information is shown in a pie chart, as a percentage distribution of the events.
Example:

NOTE: The colors in the chart are shown dimmed if the events had no expected impact. The colors in the chart are shown solid if one or more events had an expected impact.
TIP: Place your pointer on a section in the chart to open a tooltip showing the number of events in each category. Click a section to separate it from the pie.
For information about configuring Power Quality gadgets, see Configuring Gadgets.