NOTE: This report is part of the Energy Analysis Reports Module. This module requires a separate license.
Summary
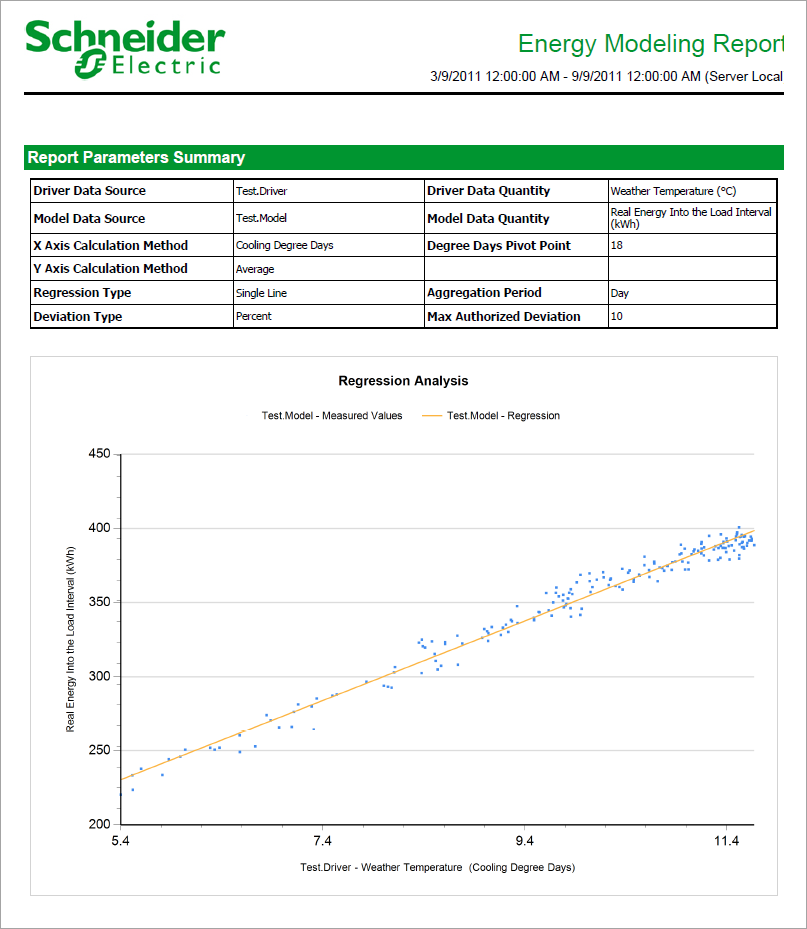
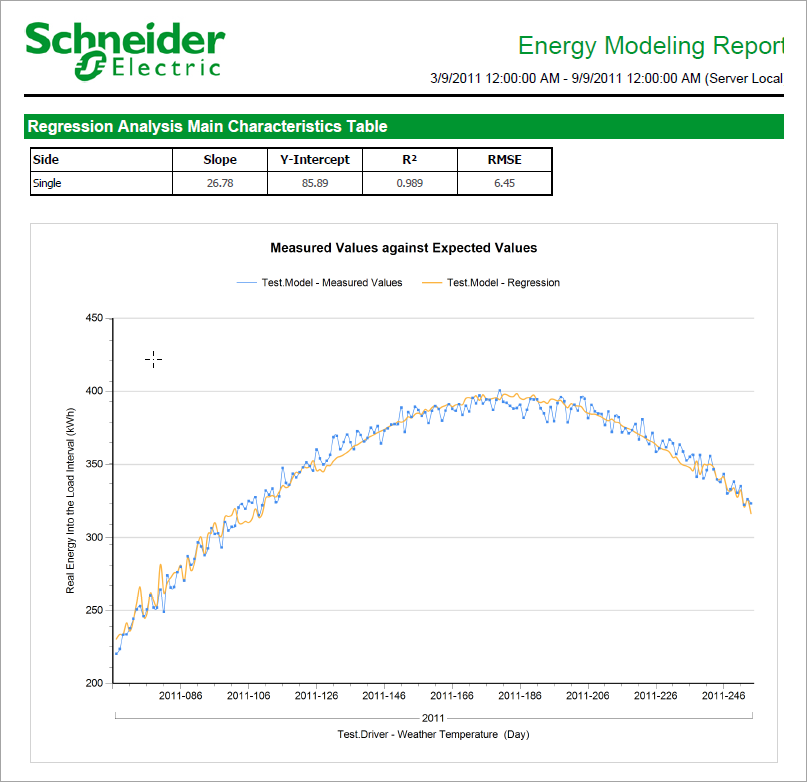
The Energy Regression Analysis Report uses simple regression analysis to model load behavior with respect to an influencing driver, such as weather. Use this report to compare the performance of your facility or of a load to the expected (modeled) behavior.
Details
See Interpreting the Energy Regression Analysis Report results for more information on this topic.
Prerequisites
- The Energy Analysis Reports Module must be configured.
- The measurement data must be available as historical data logs in the database.
Report inputs
Type a title for the report in the text box.
Click Select Source, and then choose from the dropdown list a Grouping: None, Group Name, Site, or Device Type. Navigate to and select a source, and then click OK.
Click Select Measurement. Navigate to and select a measurement, and then click OK.
Click Select Source, and then choose from the dropdown list a Grouping: None, Group Name, Site, or Device Type. Navigate to and select a source, and then click OK.
Click Select Measurement. Navigate to and select a measurement, and then click OK.
Use this input to select the timeframe for the data you want to view in the report.
Select the reporting period from the dropdown list. The timeframe options in the timeframe dropdown are relative to the date the report is run. To run a report that starts and ends in the past, select the fixed date option. Type a start and end date in the date boxes or click the arrows beside the dates to display a pop-up calendar and select a date. Type a time in the time boxes or click the up and down arrows beside the time to adjust the hours or minutes up or down. You can also run a report that starts and ends in the future. You must manually add the future data. You can use any tool to generate future data. For example, use Manual Data Editor to manually enter measurement data.
Select the timezone you want to view timestamps in.
Choose from the dropdown list Single-Line or Broken-Line.
Choose from the dropdown list one of the following methods: Cooling Degree Days, Heating Degree Days, Average, Sum, or Delta.
The Degree Days Pivot Point is the point where either heating or cooling is required to keep the temperature within the designated degree range.
Choose from the dropdown list one of the following methods: Average, Sum, or Delta.
This input determines the period of time over which data is accumulated for presentation in the report, such as day, week, and so on. From the dropdown list, select the aggregation interval that you want to use. If a custom report includes a predefined aggregation interval, contact the owner to adjust the interval for your use.
Exclude weeks that are incomplete from the report.
Exclude days that are incomplete from the report.
Exclude days that contain rollover from the report.
Enter a percentage or specific value to specify the type of deviation to show in the report.
Enter a value by which deviation is allowed for the report.
Click Yes to include data notifications in the report. If there are none, the section is not included. Click No to exclude this section.
Select whether or not to show report parameters in the generated report. The default is Yes.
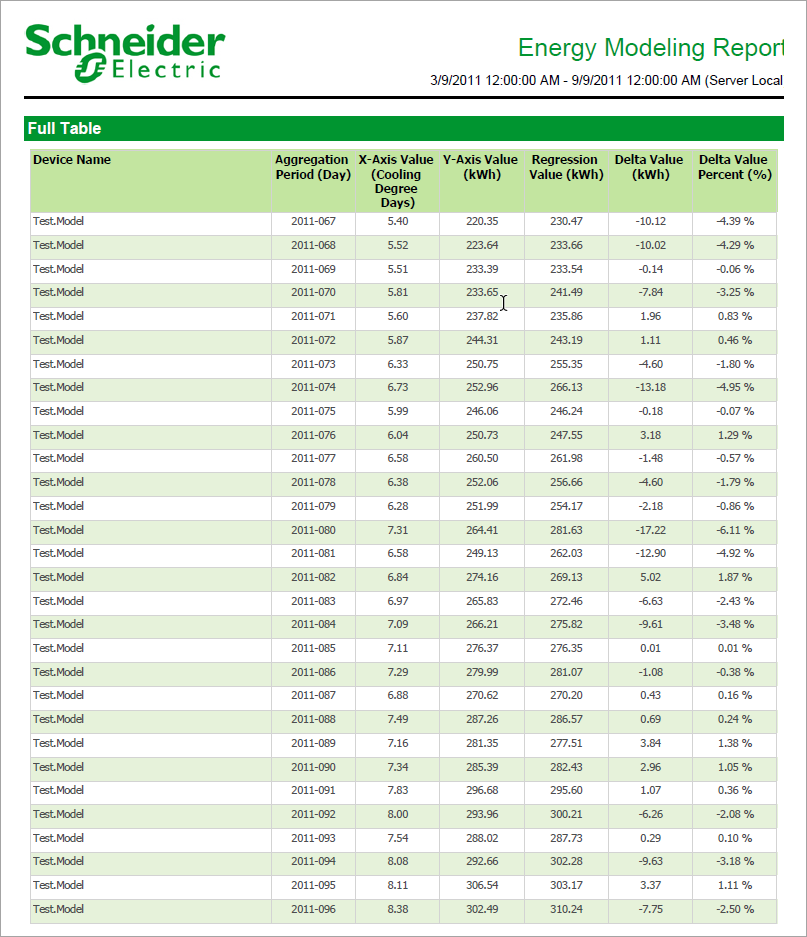
Example:


NOTE: This example only shows selected content from the report, it does not show the entire report.