KPI Report
NOTE: This report is part of the Energy Analysis Reports Module. This module requires a separate license.
Summary
The KPI Report calculates a Key Performance Indicator (KPI) based on one or more input parameters. The input parameters can be electrical and non-electrical consumption data, weather data, and business-related data. Use this report to translate energy consumption into business relevant information that you can use to benchmark and improve your energy productivity.
Details
To calculate the KPI, you must specify the input parameters, the formula that is used to calculate the KPI from the input parameters, the measurement that is used to represent the KPI output value, and a number for processing instructions. See the report inputs list below for details.
Prerequisites
- The Energy Analysis Reports Module must be configured.
- The measurement data must be available as historical data logs in the database.
Report inputs
Type a title for the report in the text box.
Select the aggregation time interval for the reporting data.
NOTE: This note is applicable for KPI report. For the selection of Hourly, Daily, Weekly, or Yearly value for Rollup parameter, the measurement values are always aggregated for the selected measurements based on the interval values. For non-cumulative measurements, it is recommended to select Interval value. For example, if Mean Current measurement is selected and the Rollup is set to Interval, the Mean Current measurements for the selected interval is displayed. If Rollup is set to Hourly, the Mean Current measurement values are displayed as aggregated values and not average values.
NOTE: Interval Rollup is available only for the following reports: KPI reports, Measurement aggregation export report, Measurement aggregation report and Multiple trend report.
Select one or more measurements and their sources, to be used in the calculation of the KPI. Each measurement is associated with a label, for example A,B,C, ... which you use to define the KPI formula.
Enter the name of the source for which the calculated KPI values are logged in Power Monitoring Expert. The source is created automatically, if it does not exist already.
Select the measurement that is used to represent the KPI output value. The calculated KPI values will be logged under this measurement and the KPI Source. Use the KPI Measurement Override if you cannot find a suitable output measurement.
Only use this input if you cannot find a suitable measurement under KPI Measurement.
Manually enter the name of a measurement to be used to represent the KPI output value. This overrides any measurement selected under KPI Measurement. If the measurement you enter does not already exist in Power Monitoring Expert, it is created.
Enter the mathematical formula that is used to calculate the KPI from the input parameters. Use the labels that are associated with the input parameters in the Input Source Measurements section as variables in the formula. You can use the following operators +, -, /, *, Pow(), Sqrt().
Here are some examples of valid formula syntax:
- (A + B) / C
- A + B + C
- C / (A + B)
- Pow(A+B+C,2)
- Sqrt(A+B)
Click No to preview the report outputs without saving them to the database. Click Yes to save the report outputs in the database.
The report overwrites any values, for this KPI, that already exist in the database from previous report runs.
Use this input to select the timeframe for the data you want to view in the report.
Select the reporting period from the dropdown list. The timeframe options in the timeframe dropdown are relative to the date the report is run. To run a report that starts and ends in the past, select the fixed date option. Type a start and end date in the date boxes or click the arrows beside the dates to display a pop-up calendar and select a date. Type a time in the time boxes or click the up and down arrows beside the time to adjust the hours or minutes up or down. You can also run a report that starts and ends in the future. You must manually add the future data. You can use any tool to generate future data. For example, use Manual Data Editor to manually enter measurement data.
Select the timezone you want to view timestamps in.
Click Yes to include data notifications in the report. If there are none, the section is not included. Click No to exclude this section.
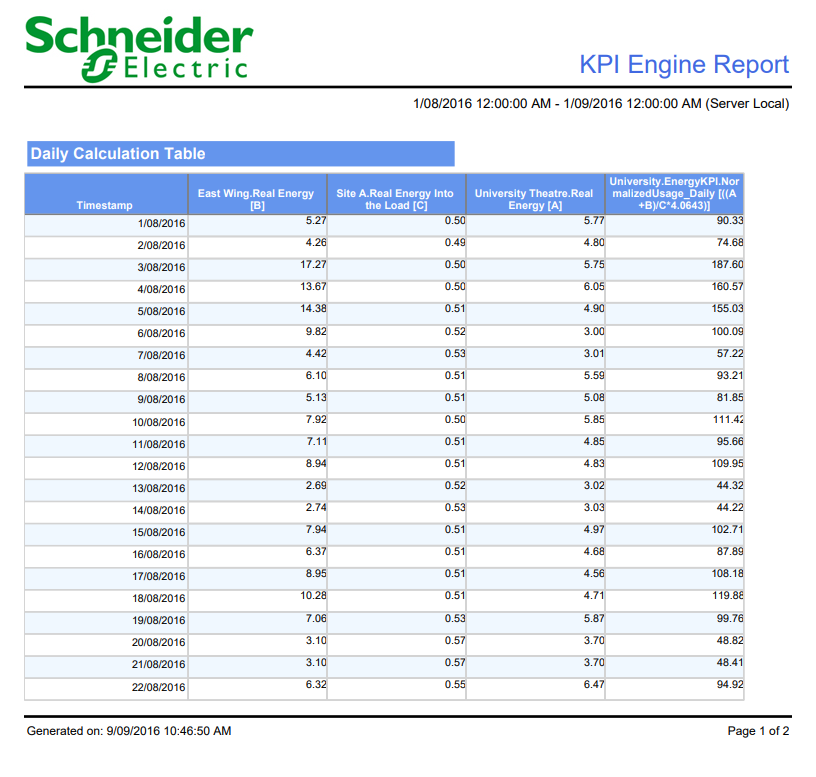
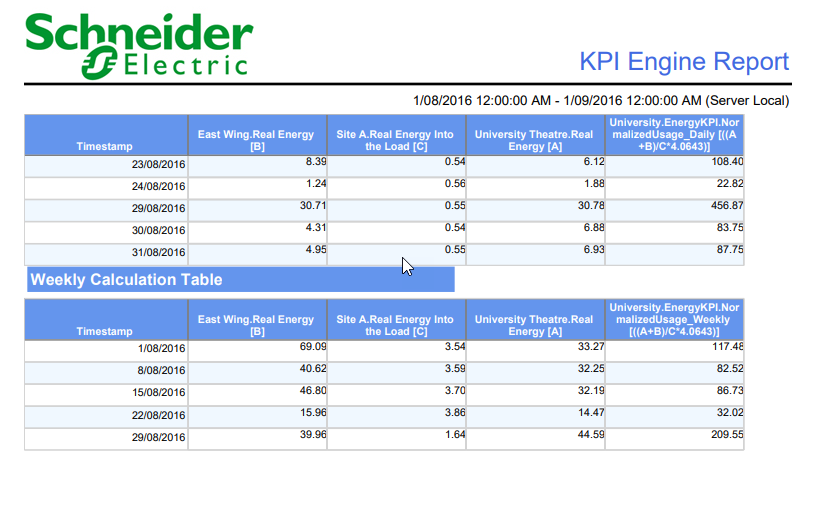
Example:


NOTE: This example only shows selected content from the report, it does not show the entire report.