NOTE: This report is part of the Energy Analysis Reports Module. This module requires a separate license.
Summary
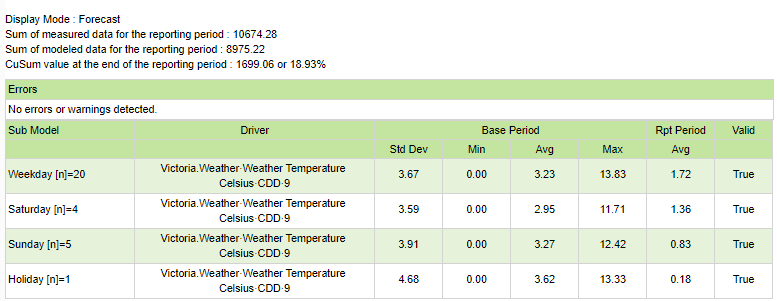
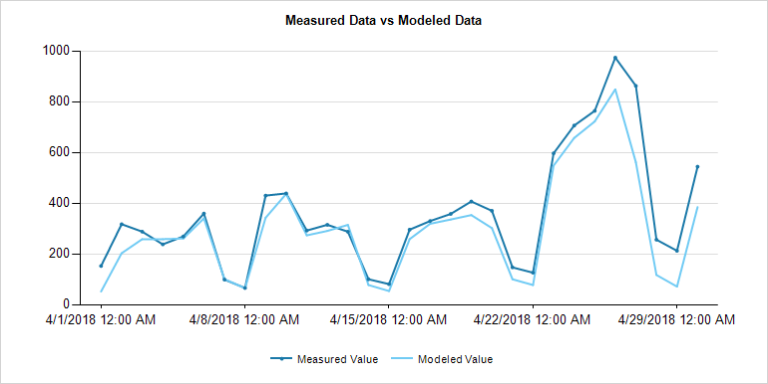
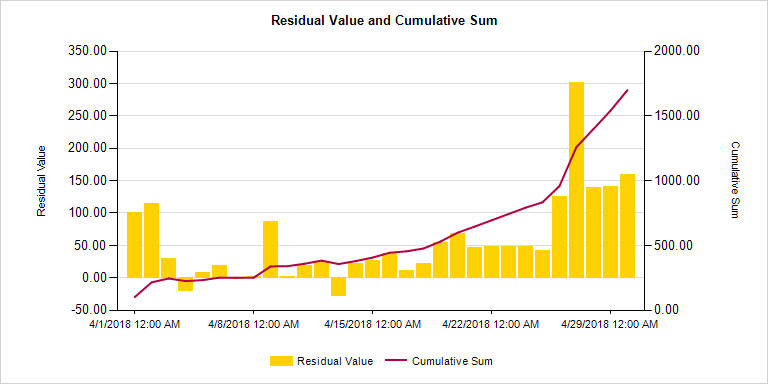
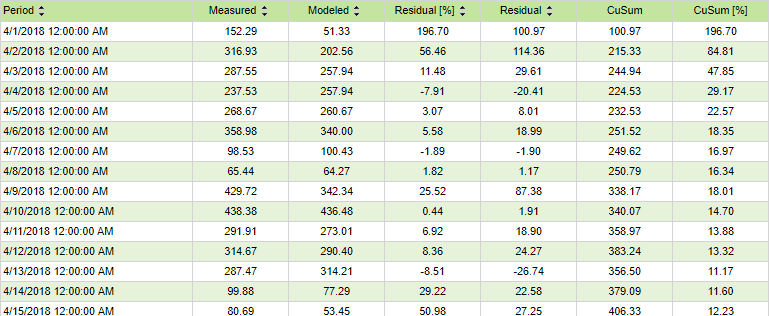
The Use Model Report shows the expected consumption of your facility or process, based on a model created with the Create Model Report. The report shows modeled data, the measured data, and the delta between the two. Use this report to find unexpected changes in your consumption, or to find actual savings as a result of energy management measures.
NOTE: The report is not limited to energy consumption modeling. You can use it to model any quantity that is dependent on drivers, for example you can model Power Factor based on power demand.
Prerequisites
To use this report, at least one model must have been defined for your facility or process. The data for the independent variables must be available in the Power Monitoring Expert database for the reporting period.
Report inputs:
Type a title for the report in the text box.
Select the model you want to use for the report from the Model drop-down list.
Select the aggregation interval you want to use for the report from the Reporting Aggregation Interval drop-down list. The options available in this drop-down list depend on the selected model.
Select in which form you would like to see the report output from the Display Mode drop-down list.
The following display modes are available:
| Forecast: Compare the model output for the reporting period to the actually measured data for that period, where the model was created for a baseline period in the past. |
| Backcast: Compare the model output for a past period to the actually measured data for that period, where the model was created for the reporting period in the present time. |
Use this input to select the timeframe for the data you want to view in the report.
Select the reporting period from the dropdown list. The timeframe options in the timeframe dropdown are relative to the date the report is run. To run a report that starts and ends in the past, select the fixed date option. Type a start and end date in the date boxes or click the arrows beside the dates to display a pop-up calendar and select a date. Type a time in the time boxes or click the up and down arrows beside the time to adjust the hours or minutes up or down. You can also run a report that starts and ends in the future. You must manually add the future data. You can use any tool to generate future data. For example, use Manual Data Editor to manually enter measurement data.
Select the timezone you want to view timestamps in.
Choose to include the actual data with the modeled data or not by selecting Yes or No for Include Measured Data.
(Optional) Enter coefficients that are applied to the modeled data to adjust the model output based on known or expected changes.
For example, if you implemented an energy conservation measure on June 1, 2016 for which you are expecting an energy saving of 15%, enter -15 as a coefficient and June 1, 2016 as the start date from which to apply it on. All modeled data, starting with that date, will be adjusted by -15%. You can add multiple coefficients at multiple dates. Coefficients are applied cumulatively, on top of any previously applied coefficients.
To specify a coefficient,
- Enter the coefficient value in percent, including the sign, in the text box.
- Enter the date on which this coefficient takes effect into the date box.
To add additional coefficients, click the + sign next to the coefficient text box. Click - to remove a coefficient.
You can save the output of the model report into the Power Monitoring Expert database and use it for display in Dashboards and Trends. The source name created for this data in the database is Modeled_Data.<model name>. The following measurements will be recorded for this source:
| Measured: This is a copy of the dependent variable measured data. |
| Modeled Data: This is the data calculated by the model for the dependent variable. |
| Residual: This is the delta between the Measured data and the Modeled data |
| Residual%: This is the Residual data in percent. |
To save the data into the database, select Yes for Insert Data.
TIP: Setup a subscription to run the model report weekly for the last 7 days and save the output into the database. This will ensure you have a complete data set for modeled data for use in Dashboards and Trends.
Example:


TIP: Move your pointer over the chart line to see tooltips with measurement details.


NOTE: This example only shows selected content from the report, it does not show the entire report.
To calculate the models,