Summary
The Energy Period over Period Report shows energy consumption for one or more loads for two different time periods. Use this report to detect changes in consumption over time, for example this month vs. the same month last year.
Prerequisites
- The measurement data must be available as historical data logs in the database.
Report inputs
Type a title for the report in the text box.
Use this input to select the devices you want to include in the report.
Click Select Sources to open the Source Selector dialog. From the Grouping list, select the way in which you want to display the sources (for example by device type, by group name, and so on). Click + and - to expand and collapse items in the navigation tree. Click the check box beside a device (or group of devices) to select it. Click Select All or Select None in the top-right corner to select or clear all the check boxes.
After selecting the devices, click OK.
Use this input to select the measurements you want to include in the report.
Click Select Measurement to open the Measurement Selector dialog. Click + and - to expand and collapse items in the navigation tree. For reports where you can select multiple measurements, click the check box beside a measurement (or group of measurements) to select it. For reports where you can only select a single measurement, click the measurement name to select it.
After selecting the measurements, click OK.
The Reporting Period input contains the following fields and dropdown lists:
- Timezone: Select whether you want to view timestamps in either Server Local Time or UTC (Universal Coordinated Time).
- Aggregation Period: Select the block of time for which you want to compare data (i.e., day, week).
- Comparison Type: Select what period of data you want to compare the selected Aggregation Period to (i.e., today vs. the same day from the previous month or current month vs. the same month from the previous year). The options vary depending on the Aggregation Period selected.
- Number of Comparisons: Enter the number of periods you want to compare.
- Aggregation Interval: This input appears when you select Month for the Aggregation Period. Select how you want data grouped for the report: by date (Day of Month) or the day of the week.
- Selected Dates: This box displays the dates of the data that will appear in the report based on the options selected.
For example, to compare the selected measurements for the same day of the month over the last 12 months, set Aggregation Period to Day, set Comparison Type to Today vs. Same Weekday From Previous Month, and enter 12 in the Number of Comparisons field.
Select whether or not to scale the chart normally. Selecting No, sets the starting point of the Y-axis at zero. The default is Yes.
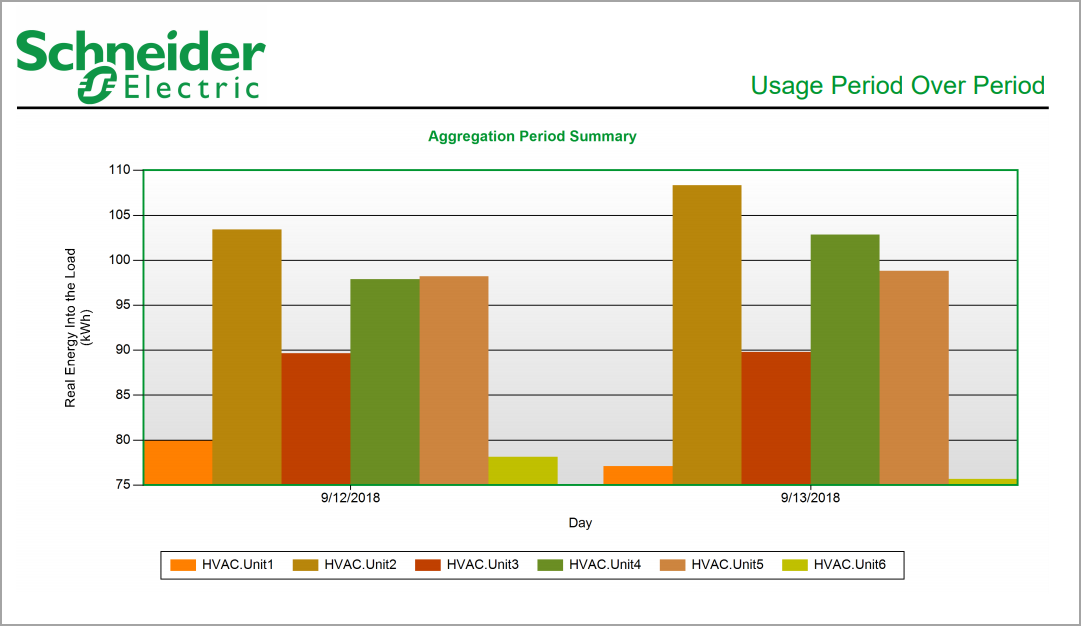
Select whether or not to include a bar chart in the generated report showing a summary of the measurement you chose for the selected sources. The default is Yes.
Select whether or not to include a stacked chart in the generated report showing the measurement you chose for the selected sources. The default is No.
Select whether or not to include a line chart in the generated report showing the measurement you chose for the sources for each hour in the 24-hour period for the specified days. The default is No.
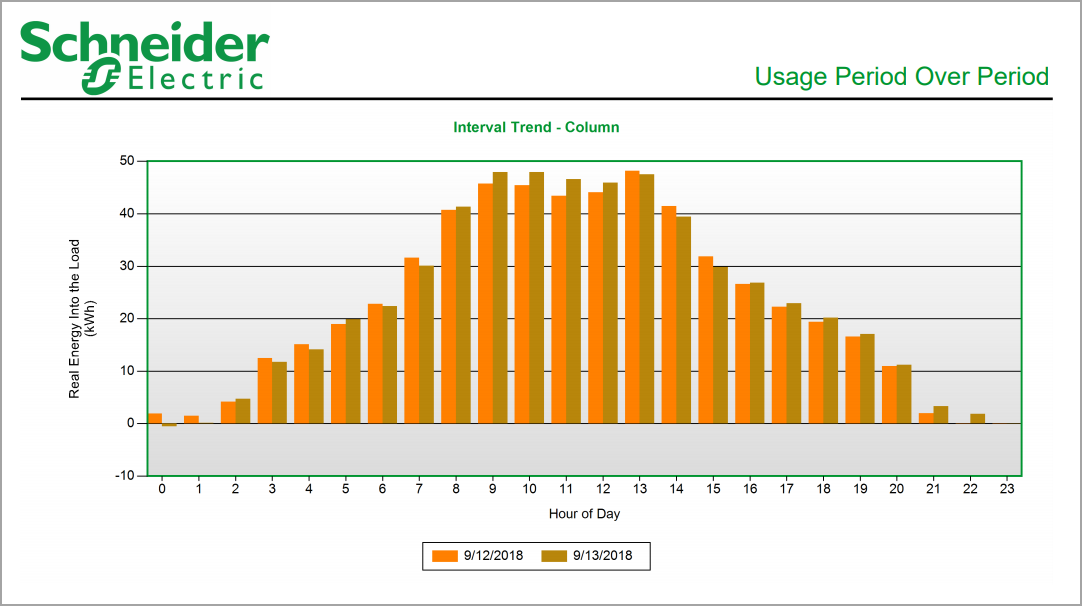
Select whether or not to include a bar chart in the generated report showing the measurement you chose for the sources for each hour in the 24-hour period for the specified days. The default is Yes.
Select an option for the format of the label describing the source. The options are Source Name, Source Description, and Combined Name/Description.
NOTE: The source description is the description that was entered in Management Console or Device Manager for a source, when the source was added or edited.
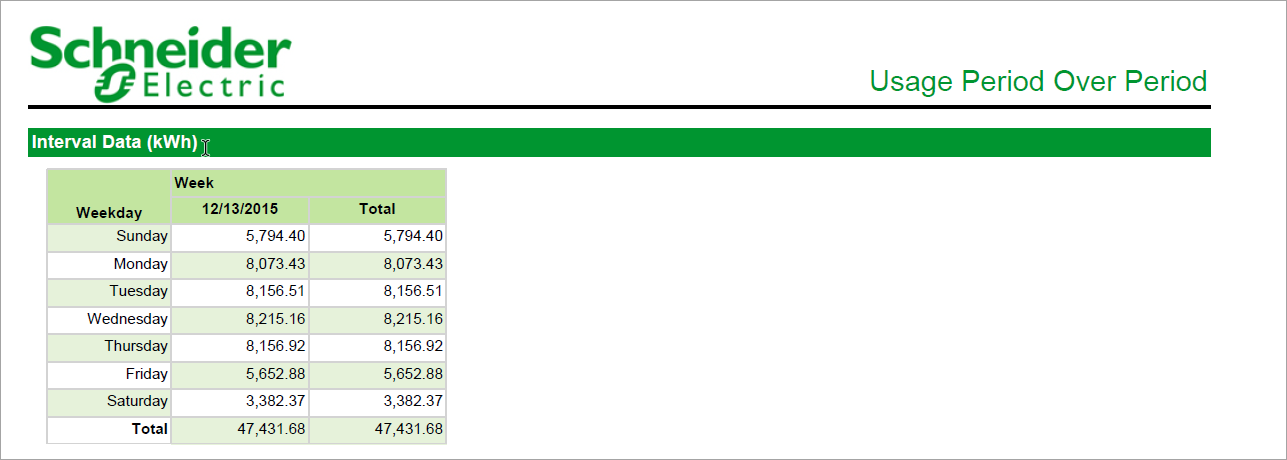
Select whether or not to show the data table in the generated report. The default is No.
Click Yes to include data notifications in the report. If there are none, the section is not included. Click No to exclude this section.
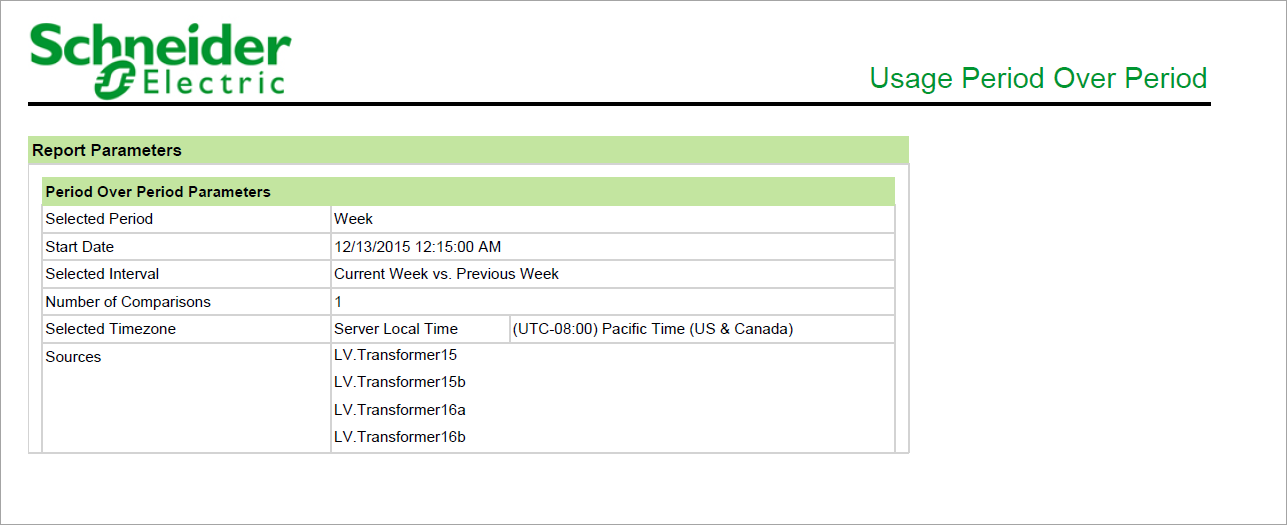
Example:


NOTE: This example only shows selected content from the report, it does not show the entire report.