Measurement Aggregation Export Report
NOTE: This report is part of the Data Exchange Module. This module requires a separate license.
Summary
The Measurement Aggregation Export Report gives aggregated logged measurement data in tabular format. It provides the same data as the Measurement Aggregation Report but in CSV, RepGen compatible, or Tidy file export formats. Use this report to share consumption data with third-party systems or for use in existing RepGen reports.
NOTE: RepGen is a Microsoft Excel based reporting system that was part of earlier versions of PME.
NOTE: The output file of this report is saved to the PME server, not the web client computer.
Prerequisites
- The measurement data must be available as historical data logs in the database.
Report inputs
The Source Selector dialog provides options to show Devices or Views:
Use the Devices option to select the devices you want to include in the report.
From the Grouping list, select the way in which you want to display the sources (for example by device type or by group name). Click + and - to expand and collapse items in the navigation tree. Click the check box beside a device (or group of devices) to select it. Click Select All or Select None in the top-right corner to select or clear all the check boxes.
After selecting the devices, click OK.
Use the Views option to select a hierarchy view (a tree of relationships) or virtual meters. The hierarchy views and virtual meters are configured in the Hierarchy Manager component. (See the Hierarchy Manager Help for further information about hierarchies, virtual meters, and views.) Click + and - to expand and collapse items in the tree. Click the check box beside any hierarchy item in the tree or any virtual meter to select it.
Click OK after making your selections.
Use this input to select the measurements you want to include in the report.
Click Select Measurement to open the Measurement Selector dialog. Click + and - to expand and collapse items in the navigation tree. For reports where you can select multiple measurements, click the check box beside a measurement (or group of measurements) to select it. For reports where you can only select a single measurement, click the measurement name to select it.
After selecting the measurements, click OK.
Use this input to select the timeframe for the data you want to view in the report.
Select the reporting period from the dropdown list. The timeframe options in the timeframe dropdown are relative to the date the report is run. To run a report that starts and ends in the past, select the fixed date option. Type a start and end date in the date boxes or click the arrows beside the dates to display a pop-up calendar and select a date. Type a time in the time boxes or click the up and down arrows beside the time to adjust the hours or minutes up or down. You can also run a report that starts and ends in the future. You must manually add the future data. You can use any tool to generate future data. For example, use Manual Data Editor to manually enter measurement data.
Select the timezone you want to view timestamps in.
Select the aggregation time interval for the reporting data.
NOTE: This note is applicable for KPI report. For the selection of Hourly, Daily, Weekly, or Yearly value for Rollup parameter, the measurement values are always aggregated for the selected measurements based on the interval values. For non-cumulative measurements, it is recommended to select Interval value. For example, if Mean Current measurement is selected and the Rollup is set to Interval, the Mean Current measurements for the selected interval is displayed. If Rollup is set to Hourly, the Mean Current measurement values are displayed as aggregated values and not average values.
NOTE: Interval Rollup is available only for the following reports: KPI reports, Measurement aggregation export report, Measurement aggregation report and Multiple trend report.
Select the aggregation method to be used for rolling up non cumulative measurements. Examples of non cumulative measurements include Voltage, Current, Power. An example of a cumulative measurement is Energy. Cumulative measurements are aggregated by summation.
Select if you want to use a time of use (TOU) schedule with this report. If you want to use a TOU schedule, select a TOU schedule from the list. The list shows the existing TOU schedules that are configured in the system. If you have not created a TOU schedule, the field shows that no schedule is available.
Select to include or exclude data records in the report output that have no data. If Rollup is Interval, an empty data record will be shown as an empty row or column in the table with the corresponding interval timestamp. This can be useful for data exporting to avoid missing rows.
This setting works together with Include Empty Intervals. When Include Empty Intervals is turned on, the system uses the Base Interval to determine the timestamps for the empty records that are inserted.
NOTE: For Measurement Aggregation Export Report, you can use the Export Format parameter to select the export format. For Measurement Statistics Export Report, you can export the report output files in CSV format only. No specific parameter is available for selection of export format.
Enter a path or file share on the PME server where the report output files will be saved to. If you do not provide a file name as part of the path, the system will use the default file name DefaultExport.csv for the export file. You do not need to include an extension with the file name.
NOTE: The WebReporterAppPool application pool in IIS must have write permission on the Export File Path location. This application pool is running under the NetworkServices Identity when PME is installed with SQL Authentication. When it is installed with Windows Integrated Authentication, then the Windows account that is used to access the databases is used to run the application pool.
Examples:
Path, including file name: C:\Temp\test.
Path, without file name: C:\Temp\. (NOTE: Do not forget to include the \ at the end of the path.)
NOTE: This note is applicable for Measurement Aggregation Export Report. When the CSV (RepGen Compatible) Export Format is selected, the report output is organized by source and saved to a file with the source name. If multiple sources are selected, one output file for each source is created.
Selecting Yes overwrites an existing file if it exists and selecting No appends the new data to an existing file.
Select the format for the CSV export file. The available options are:
- CSV
Standard CSV output format. All the data is saved into a single output file. Example:
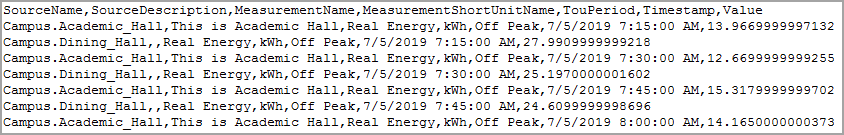
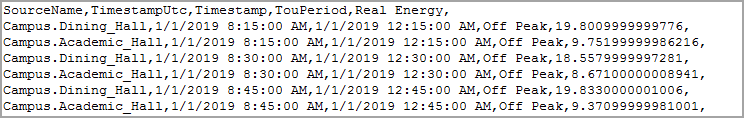
- CSV (RepGen compatible)
This format is compatible with RepGen, a Microsoft Excel based reporting system that was part of earlier versions of PME. One output file is created for each selected source. Example:
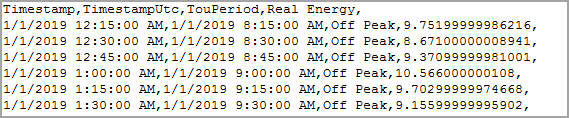
- Tidy
This format is similar to the RepGen compatible format. It includes the source names and all the data is saved into a single output file. Example:
Click Yes to include data notifications in the report. If there are none, the section is not included. Click No to exclude this section.
Example - CSV output format:
NOTE: This example only shows selected content from the report, it does not show the entire report.