Power Quality Report
Summary
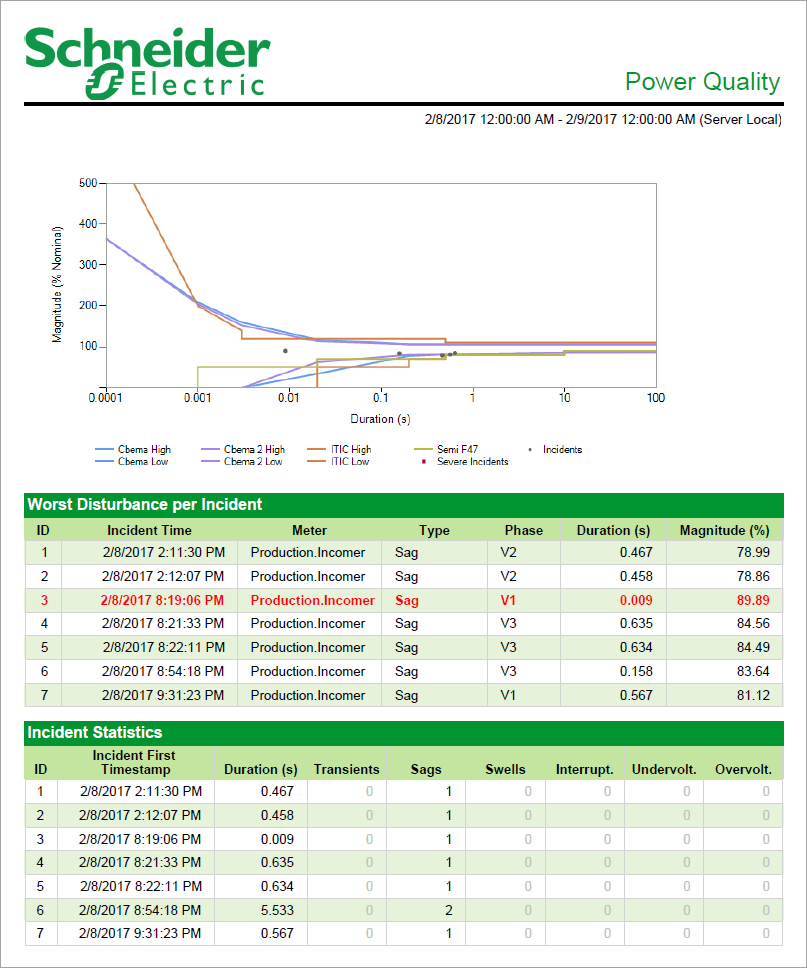
The Power Quality Report shows the number and severity of voltage sags, swells, and transients over a period of time. It includes waveform signatures and susceptibility curve plots, such as CBEMA (1996), CBEMA (Updated), ITIC, or SEMI F47. Use this report to analyze power quality (PQ) incidents, to assess possible impacts of PQ events on your facility or processes, and to help identify causes of PQ events.
Prerequisites
- The measurement data must be available as historical data logs in the database.
Report inputs
Type a title for the report in the text box.
Use this input to select the devices you want to include in the report.
Click Select Sources to open the Source Selector dialog. From the Grouping list, select the way in which you want to display the sources (for example by device type, by group name, and so on). Click + and - to expand and collapse items in the navigation tree. Click the check box beside a device (or group of devices) to select it. Click Select All or Select None in the top-right corner to select or clear all the check boxes.
After selecting the devices, click OK.
Select the incident interval that you want to use in the report (such as, 20 seconds, 10 minutes, 1 week).
The incident interval is the time window used by the generated report to group multiple disturbances together into a single incident. The default value is 20 seconds.
Use this input to select the timeframe for the data you want to view in the report. The report retrieves all events over the duration of the reporting period. The events are summarized into incidents and displayed on the report according to the Incident Interval setting.
Select the reporting period from the dropdown list. The timeframe options in the timeframe dropdown are relative to the date the report is run. Use a relative date option for reports that you want to generate on a regularly scheduled basis. To run a report that starts and ends in the past, select the fixed date option. Type a start and end date in the date boxes or click the arrows beside the dates to display a pop-up calendar and select a date. Type a time in the time boxes or click the up and down arrows beside the time to adjust the hours or minutes up or down.
Select whether you want to view timestamps in either Server Local Time or UTC (Universal Coordinated Time).
If you select a time other than the default custom time, in a Custom Day, the reporting period will show the start time to end time along with the date.
NOTE: Reports which support Start Hour and End Hour for Rollup consider the values of Start Hour and End Hour over Custom Day settings.
NOTE: Custom Day settings are not applicable for Model reports.
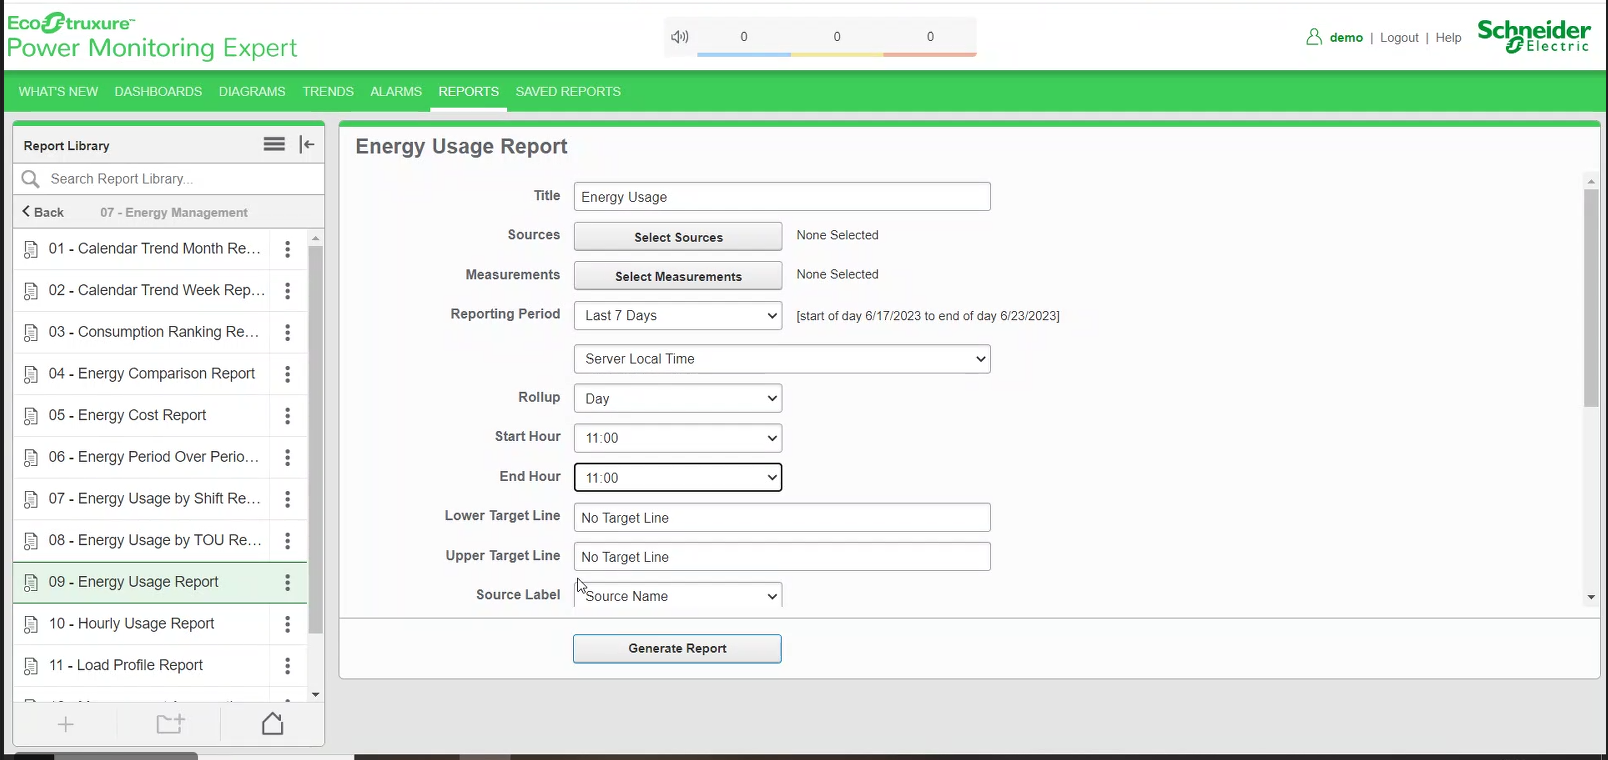
Examples of Custom Day
Example 1: Default Custom Day
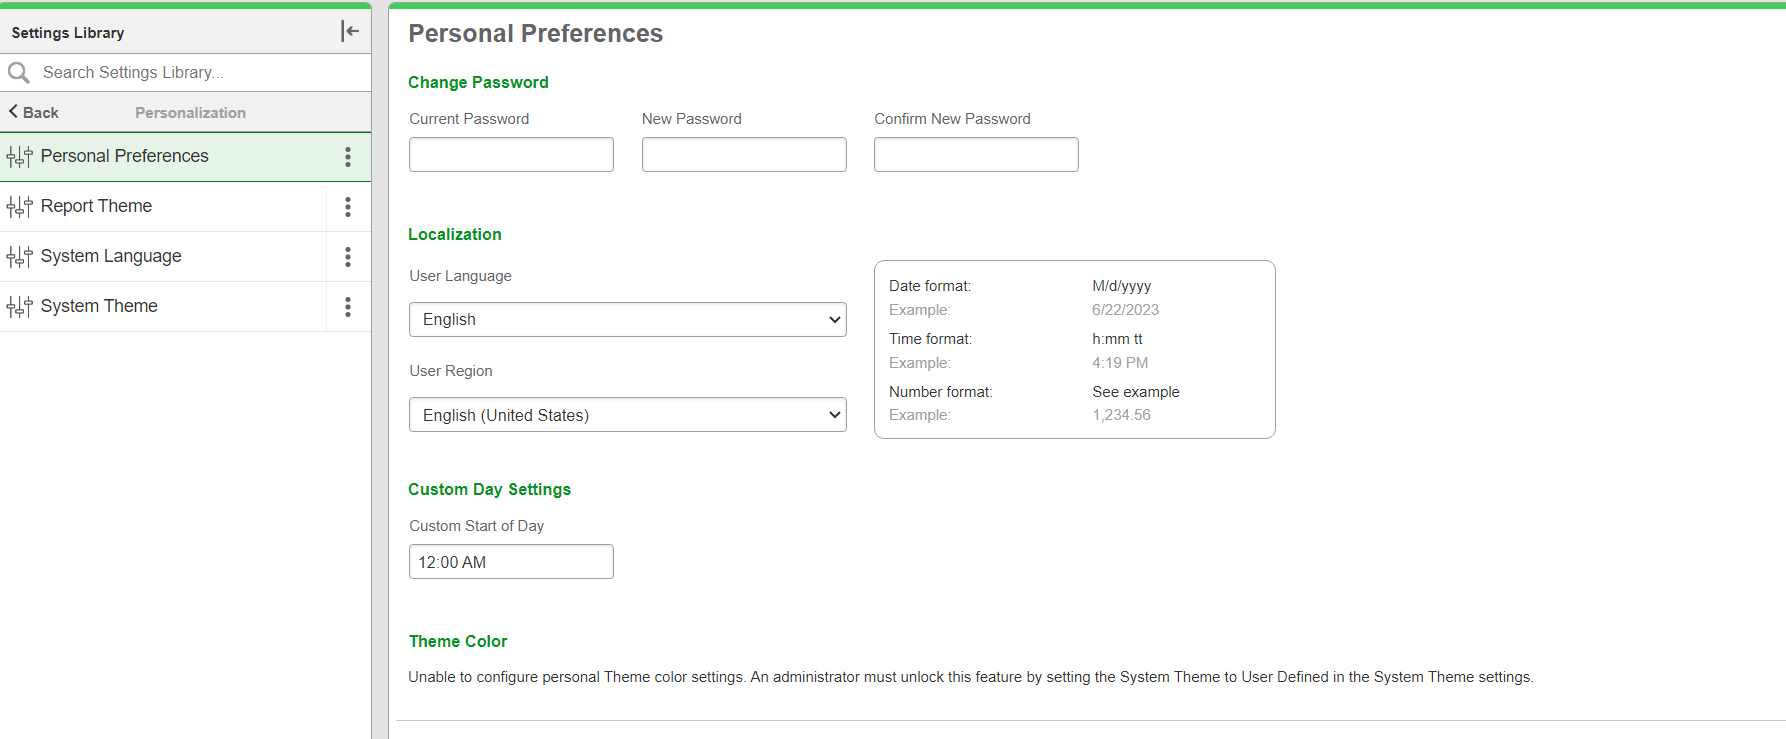

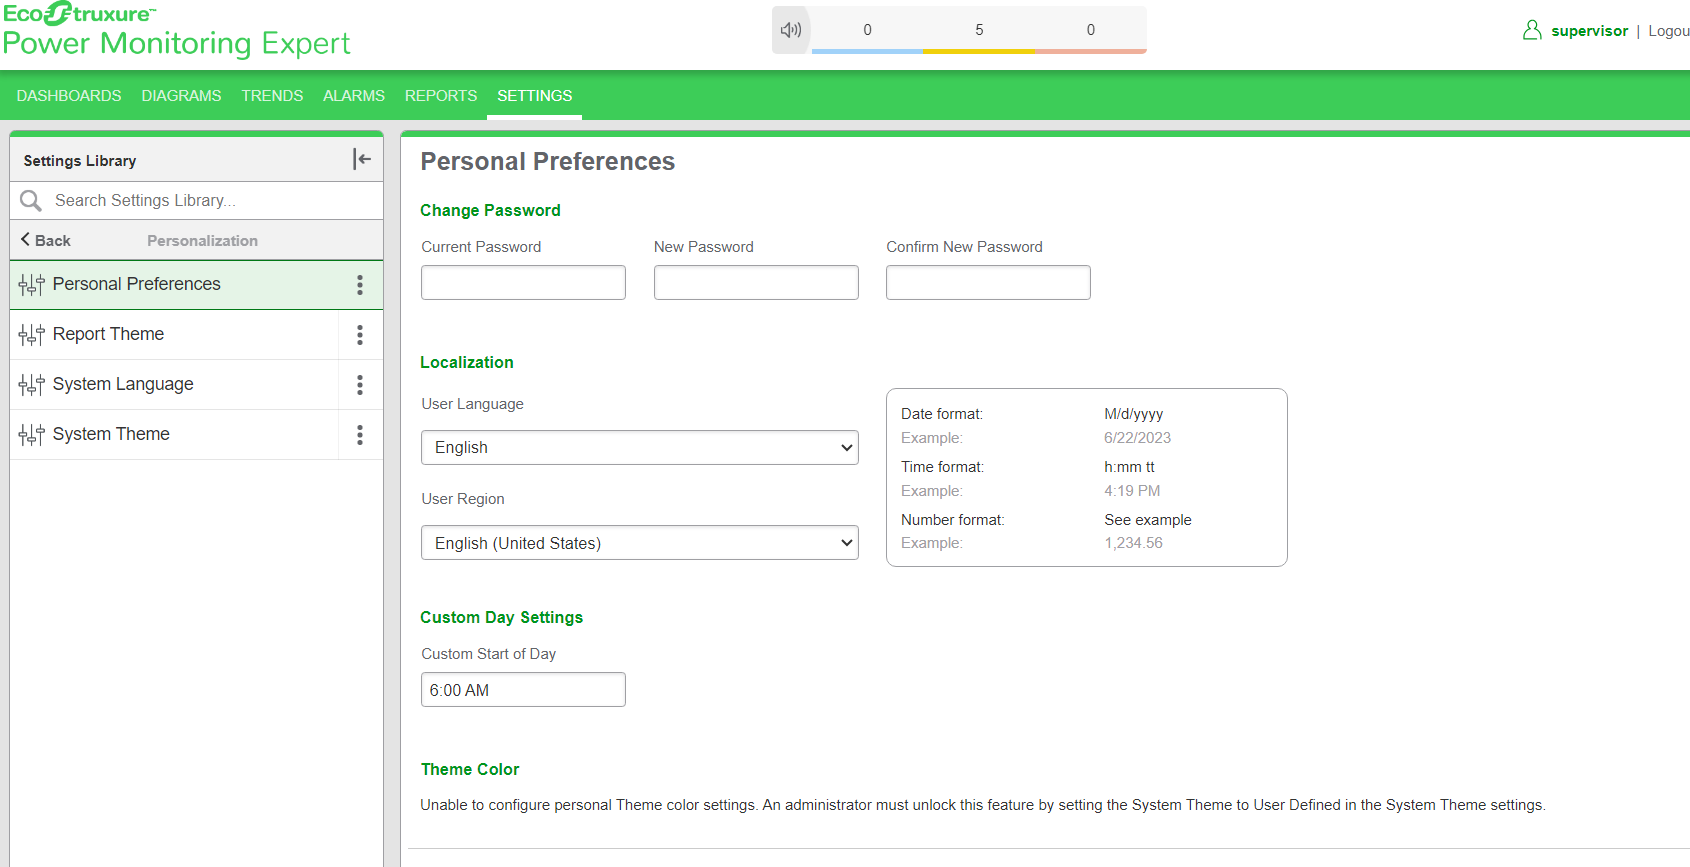
Example 2: Custom Start of Day set as 6 AM

Select an option for the format of the label describing the source. The options are Source Name, Source Description, and Combined Name/Description.
NOTE: The source description is the description that was entered in Management Console or Device Manager for a source, when the source was added or edited.
Click Yes for the power quality curve (CBEMA (1996), CBEMA (Updated), ITIC, or SEMI F47) that you want to show in the incident plots. Click No to hide the curve.
You can select one or more of the curves.
Choose one of the available percentage values to visually increase the level of detail above the nominal value. The percentage value that you select sets the maximum vertical axis in the incidents plot. The default value is 500%.
The options available for selection are Generate dynamically and Embed into single report.
-
Select Generate dynamically to generate an incident summary report only. You can click the links in the report to view incident details and also associated waveforms.
This option provides a convenient way to generate a summary of incidents to give you an indication for investigating a particular incident or waveform. This option is recommended for interactive viewing and analysis within the reporting period.
-
Select Embed into single report to include the incident summary, the incident details, and the waveforms associated with those incidents in a single generated report. This single report format facilitates exporting the information to one of the available download formats, and it also facilitates setting and delivering a report subscription. This option is recommended for attaching the report to an email.
This option provides a convenient way to extract and share power quality-related information. Although power quality events vary from system to system, it takes longer to generate the report using this option because the system queries more data, including data-intensive waveforms. To prevent possible report timeouts, it is suggested that you keep the number of waveforms to a minimum by:
- Selecting a single source.
- Specifying a reporting period of a single day or less.
Click Yes to include data notifications in the report. If there are none, the section is not included. Click No to exclude this section.
Additional information about incident details and waveform details.
Incident details:
When you use the Generate Dynamically sub-reports option, you can view details of an incident by clicking the link in the TimeStamp column in the table.
Detailed information about a single power quality incident is displayed, including:
- A CBEMA (1996), CBEMA (Updated), ITIC, or SEMI F47 curve containing the power quality disturbances for the selected incident. (The curve used in the plot is dependent on the overlay options you select for the report.)
- The timestamps, types, phases, duration, and magnitude of disturbances in the selected incident, with the worst event in the selected incident highlighted (worst event = largest magnitude x duration).
- The power quality settings of the device that registered the disturbance (for example, sag/swell limits, transient threshold, and so on).
To return to the summary report, use the report section back button on the report toolbar.
Waveform details:
When you use the Generate Dynamically sub-reports option, you can view the waveform details of an incident by clicking the waveform icon in the incident details table in the Incident sub report.
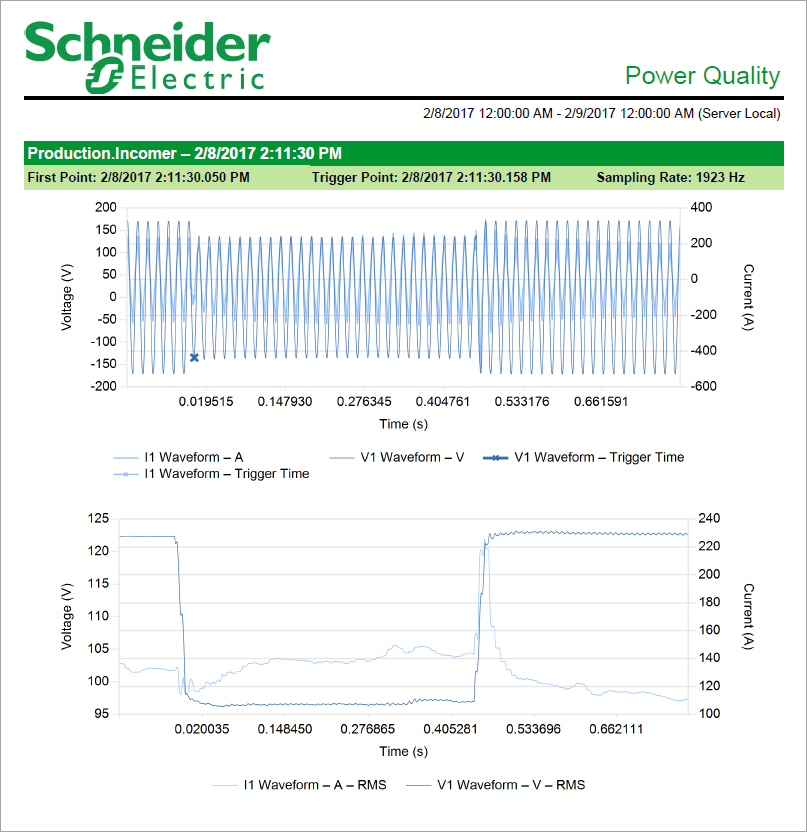
The waveform details include all the waveforms that were recorded for a disturbance. It displays a waveform chart along with an optional table with waveform values.
The following waveform plots and data are displayed, based on the timestamp selected:
- A summary waveform plot, displaying a plot of the V1, V2 and V3 waveforms.
- An individual waveform plot for each of:
- V1 and I1
- V2 and I2
- V3 and I3
- If the source queried has digital input logging enabled over the time interval of the waveforms, a waveform showing the digital input status.
- The timestamp for the time the waveforms were triggered.
- The sampling frequency of the waveforms.
To return to the summary report, use the report section back button on the report toolbar.
NOTE: For incident sub-reports with multiple events, some events might reference the same waveform recording. This can happen if the time interval between events is very short. In that case, the waveform and event trigger times for these events do not match exactly.
Example:
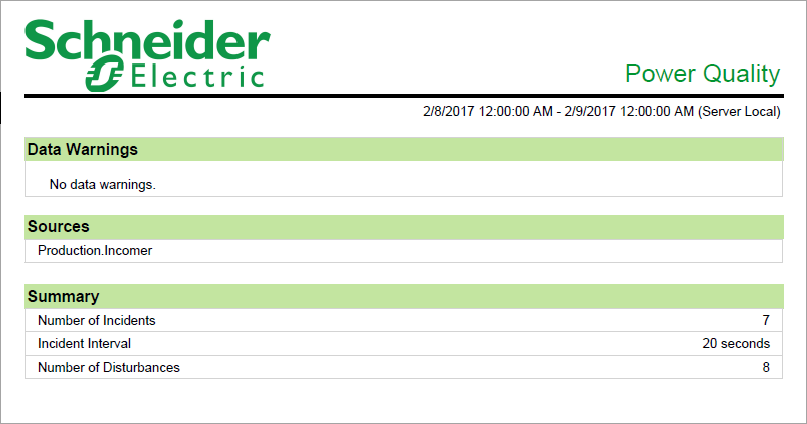
NOTE: This example only shows selected content from the report, it does not show the entire report.