NOTE: This report is part of the Power Quality Performance Module. This Module requires a separate license.
Summary
The Power Quality Analysis Report shows power quality (PQ) summary information, such as breakdowns of PQ event types, impact, and location. It also includes information on disturbances (harmonics, unbalance, and so on) and power factor. Use this report to help you understand the power quality in your facility, reduce downtime, and increase equipment reliability and availability.
Details
Depending on the events and disturbances you select, the generated report provides data categorized as follows:
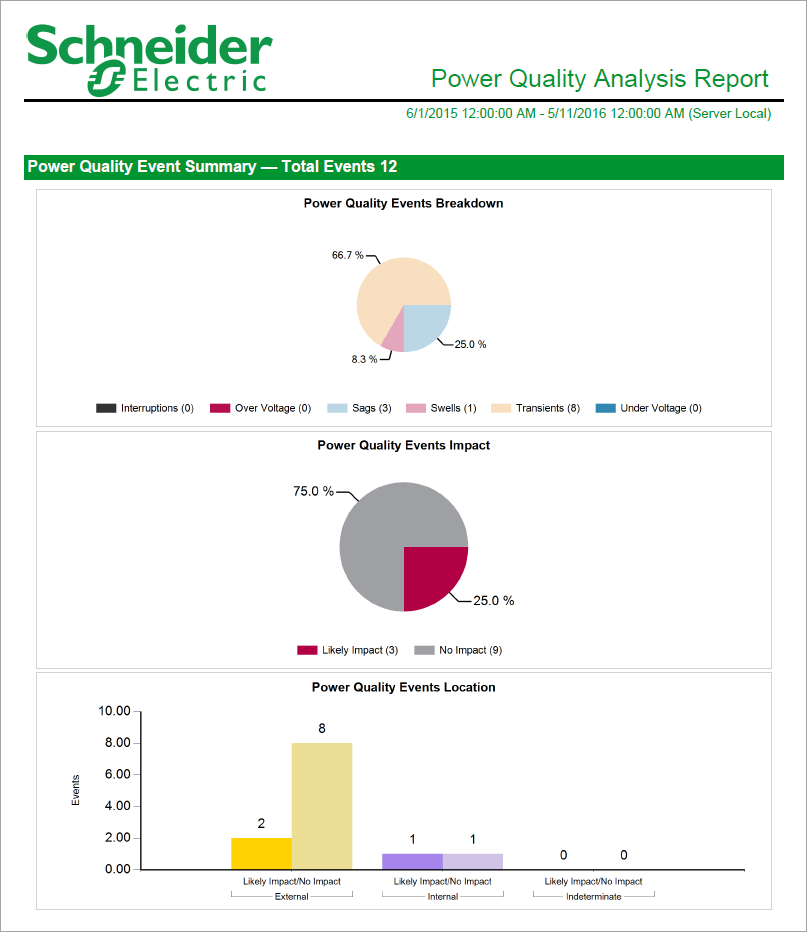
- Power Quality Event Summary, consisting of Power Quality Events Breakdown, Power Quality Events Impact, and Power Quality Events Location.
- Power Quality Events Breakdown shows the percent distribution of the events in a pie chart.
- Power Quality Events Impact shows a percent distribution of the events with a likely impact and no impact in a pie chart.
- Power Quality Events Location shows the distribution of the number of events in a bar chart with likely impact and no impact identified for each of the External, Internal, and Undetermined locations.
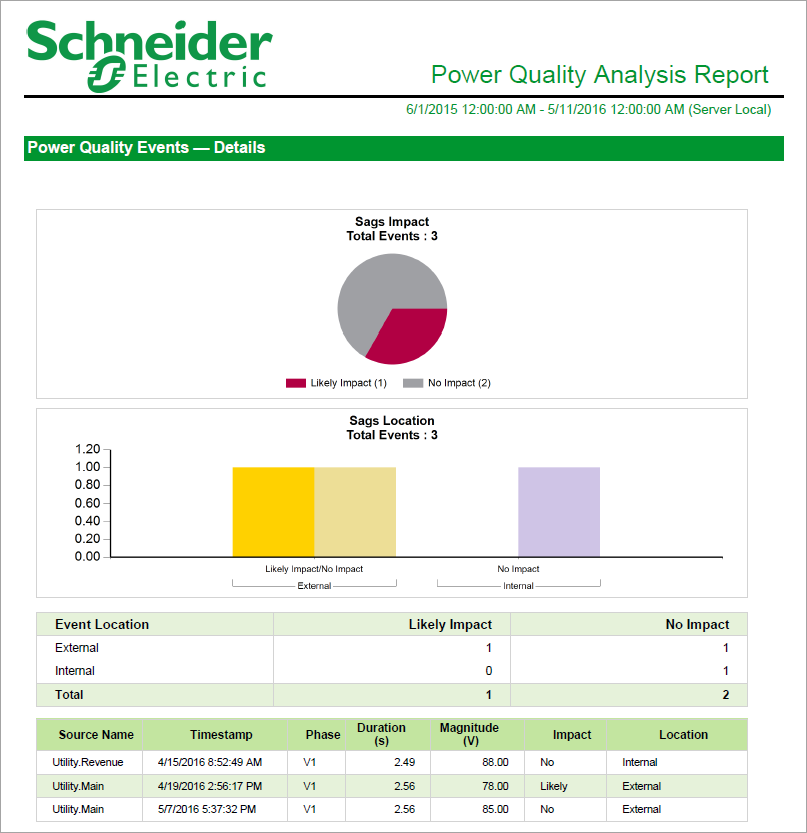
- Power Quality Events — Details, consisting of events impact and events location for each detected event. and Disturbance Details for each detected disturbance.
- Events Impact shows the number of each event type with a likely impact and no impact.
- Events Location provides a distribution of the number of each event with a likely impact and no impact in External, Internal, and Undetermined locations.
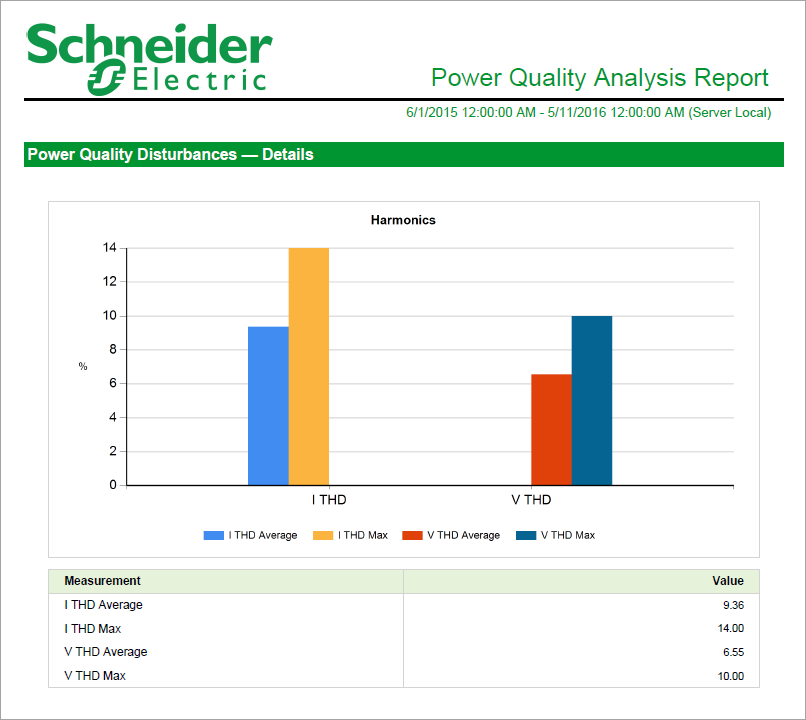
- Power Quality Disturbances — Details, consisting of a graphical representation of the distribution for each disturbance followed by a data table containing measurement and value details.
- Power Factor — Details, consisting of additional information on power quality disturbances. The logged data represented in a trend chart is for each Incomer or main meter defined in the PowerQualityGroups.csv file. The table below the chart shows Active and Reactive energy data grouped by each power source meter. The red target line in the chart is set to 92 by default on the report template page.
See Power Quality Performance events and disturbances for additional information.
Prerequisites
- The Power Quality Performance Module must be configured.
- The measurement data must be available as historical data logs in the database.
Related
- Power Quality Impact Report – provides an estimated impact of production downtime.
- Power Quality Events Breakdown, Power Quality Events Impact, and Power Quality Events Location gadgets – provide a graphical representation of power quality events.
Report inputs
Type a title for the report in the text box.
(Optional)Use this input to select the devices you want to include in the report.
NOTE: The sources listed are dependent on the views you create in Hierarchy Manager and the assigned user group. The hierarchy view is configured in the Hierarchy Manager component. (See the Hierarchy Manager Help for further information about hierarchies, virtual meters, and views.)
Click + and - to expand and collapse items in the tree. Click the check box beside any hierarchy item in the tree to select it.
Click OK after making your selections.
Use this input to select the timeframe for the data you want to view in the report.
Select the reporting period from the dropdown list. The timeframe options in the timeframe dropdown are relative to the date the report is run. To run a report that starts and ends in the past, select the fixed date option. Type a start and end date in the date boxes or click the arrows beside the dates to display a pop-up calendar and select a date. Type a time in the time boxes or click the up and down arrows beside the time to adjust the hours or minutes up or down. You can also run a report that starts and ends in the future. You must manually add the future data. You can use any tool to generate future data. For example, use Manual Data Editor to manually enter measurement data.
Select the timezone you want to view timestamps in.
Click the field to open the Events and Disturbances dialog. By default, all items under Events and Disturbances are selected, as well as Power Factor.
Clear the checkboxes for any specific items that you do not want to include in the generated report. If you clear or select Events or Disturbances, the checkboxes for all of the items included in that category are cleared or selected.
The target power factor for the site. The default target is 92, which you can change to match you site power factor target.
The target power factor is configured in the Power Factor Impact Rate.xml file when the Power Quality Performance module is commissioned. This rate file is included in the Energy Billing Module, which is subject to licensing. Contact your
Select Yes if you want to include events in the Power Quality Events — Details section of the generated report that are classified as having no impact on the power quality of your site. By default, power quality events with no impact are excluded from the generated report.
Select whether or not to show data table for power quality events in the generated report. The default is No.
Click Yes to include data notifications in the report. If there are none, the section is not included. Click No to exclude this section.
Example:


NOTE: This example only shows selected content from the report, it does not show the entire report.