SARFI Report
Summary
The System Average RMS Variation Frequency Index (SARFI) Report shows the count of voltage sags and / or swells for the selected sources based on the SARFI indices. Use this report to analyze voltage sag and / or swell incidents, to assess possible impacts on your facility or processes, and to help quantify the performance of power system.
Details
SARFI index is a power quality index that provides a count of voltage sags and / or swells for one or more selected sources. There are two types of SARFI indices: SARFI-X and SARFI-Curve:
-
SARFI-X corresponds to a count of voltage sags and / or swells below or above a specified voltage threshold. This report supports the following SARFI-X indices:
- SARFI 10
- SARFI 50
- SARFI 70
- SARFI 80
- SARFI 90
- SARFI 110
- SARFI 120
- SARFI 140
For example, SARFI-70 counts the voltage sags that are below 70% of the reference voltage. SARFI-110 counts the voltage swells that are above 110% of the reference voltage. SARFI indices assess duration of RMS variation based on the selected duration.
-
SARFI-Curve corresponds to a rate of voltage sags below an equipment compatibility curve. This report supports the following SARFI Curves:
- SARFI ITIC
- SARFI SEMI
For example, SARFI ITIC counts voltage sags that are below the lower ITIC curve. SARFI SEMI counts voltage sags that are below SEMI curve.
Prerequisites
- The measurement data must be available as historical data logs in the database.
Report inputs
Type a title for the report in the text box.
The Source Selector dialog provides options to show Devices or Views:
Use the Devices option to select the devices you want to include in the report.
From the Grouping list, select the way in which you want to display the sources (for example by device type or by group name). Click + and - to expand and collapse items in the navigation tree. Click the check box beside a device (or group of devices) to select it. Click Select All or Select None in the top-right corner to select or clear all the check boxes.
After selecting the devices, click OK.
Use the Views option to select a hierarchy view (a tree of relationships) or virtual meters. The hierarchy views and virtual meters are configured in the Hierarchy Manager component. (See the Hierarchy Manager Help for further information about hierarchies, virtual meters, and views.) Click + and - to expand and collapse items in the tree. Click the check box beside any hierarchy item in the tree or any virtual meter to select it.
Click OK after making your selections.
Use this input to select the timeframe for the data you want to view in the report. The report retrieves all events over the duration of the reporting period. The events are summarized into incidents and displayed on the report according to the Incident Interval setting.
Select the reporting period from the dropdown list. The timeframe options in the timeframe dropdown are relative to the date the report is run. Use a relative date option for reports that you want to generate on a regularly scheduled basis. To run a report that starts and ends in the past, select the fixed date option. Type a start and end date in the date boxes or click the arrows beside the dates to display a pop-up calendar and select a date. Type a time in the time boxes or click the up and down arrows beside the time to adjust the hours or minutes up or down.
Select whether you want to view timestamps in either Server Local Time or UTC (Universal Coordinated Time).
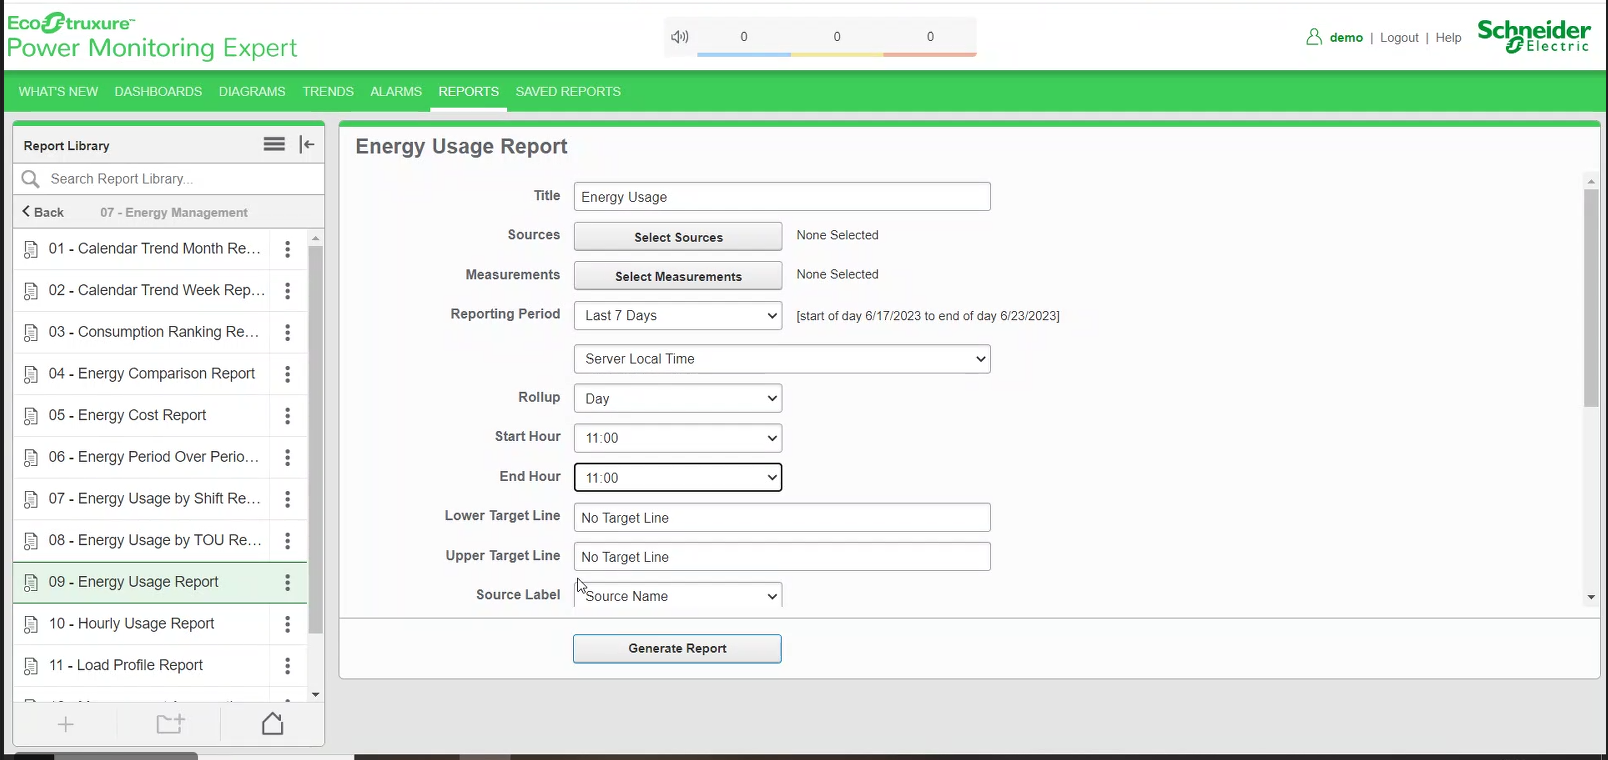
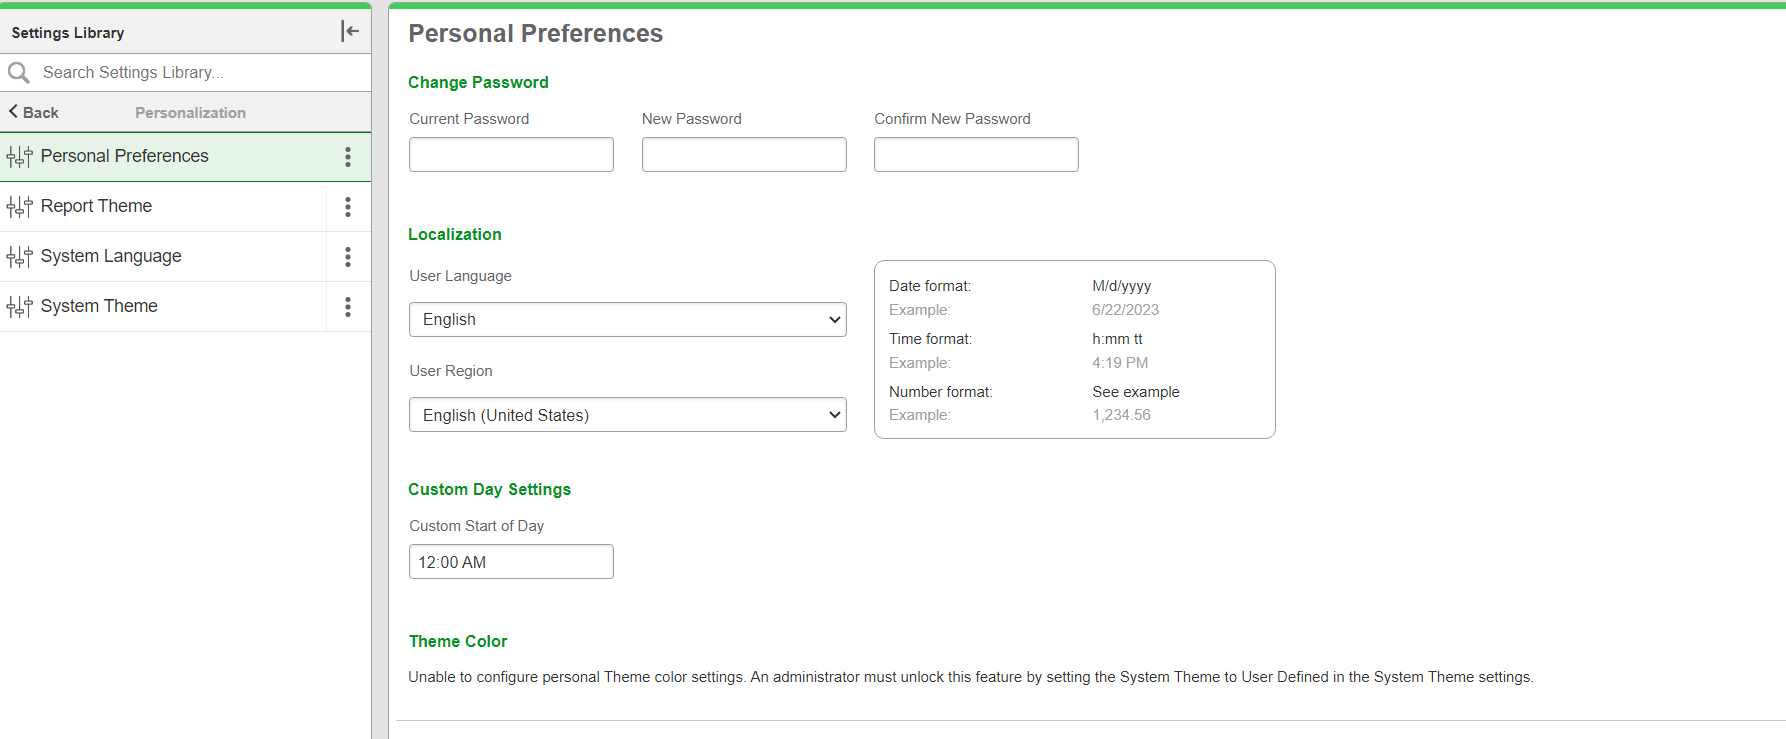
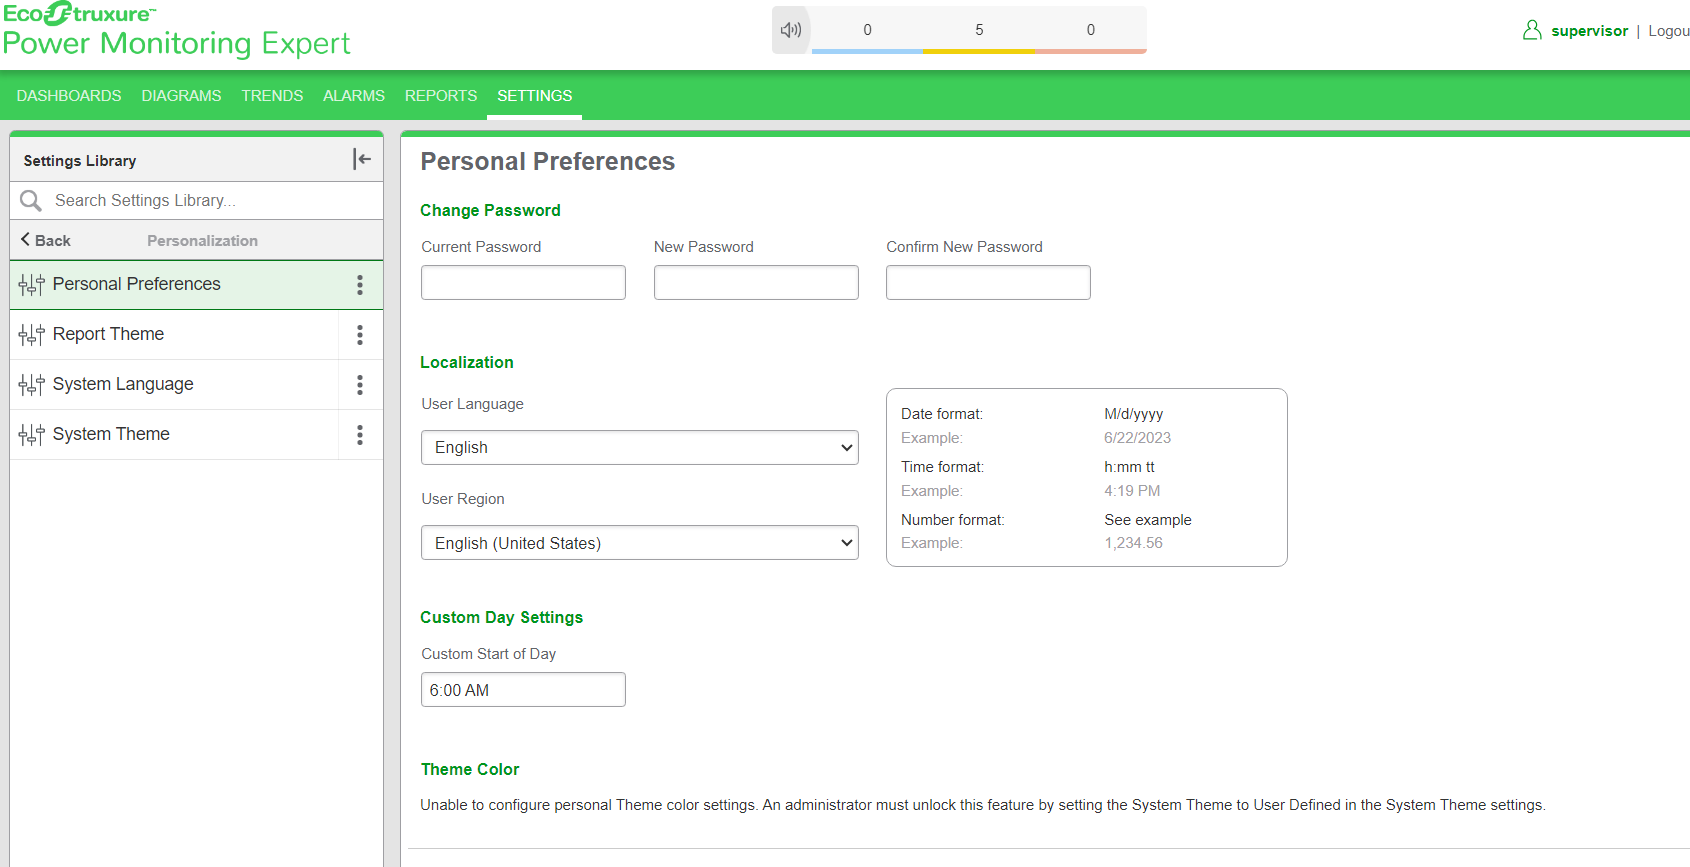
If you select a time other than the default custom time, in a Custom Day, the reporting period will show the start time to end time along with the date.
NOTE: Reports which support Start Hour and End Hour for Rollup consider the values of Start Hour and End Hour over Custom Day settings.
NOTE: Custom Day settings are not applicable for Model reports.

Examples of Custom Day
Example 1: Default Custom Day


Example 2: Custom Start of Day set as 6 AM


Select either Sources with exceptions only or All sources.
- Sources with exceptions – Shows only the devices which has voltage sags and / or swells.
-
All sources – Shows all selected devices. If the devices does not have voltage sags and / or swells, the count is displayed as zero.
Select the duration of rms variation that you want to use in the report (such as 15 seconds, 30 seconds, no limit, etc.)
The duration is the time window used by the generated report to count the voltage swag and / or swell. The default value is 60 seconds.
Click Yes to include data notifications in the report. If there are none, the section is not included. Click No to exclude this section.
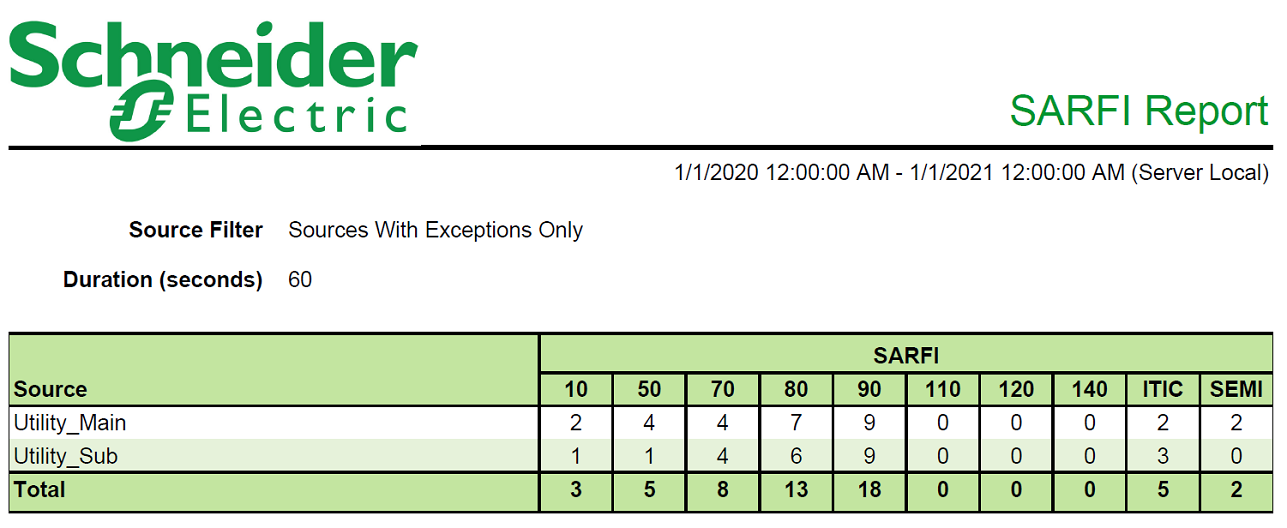
Example:

NOTE: This example only shows selected content from the report, it does not show the entire report.