Design
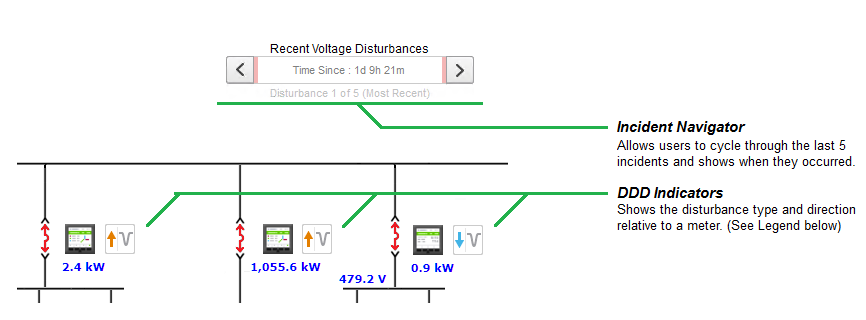
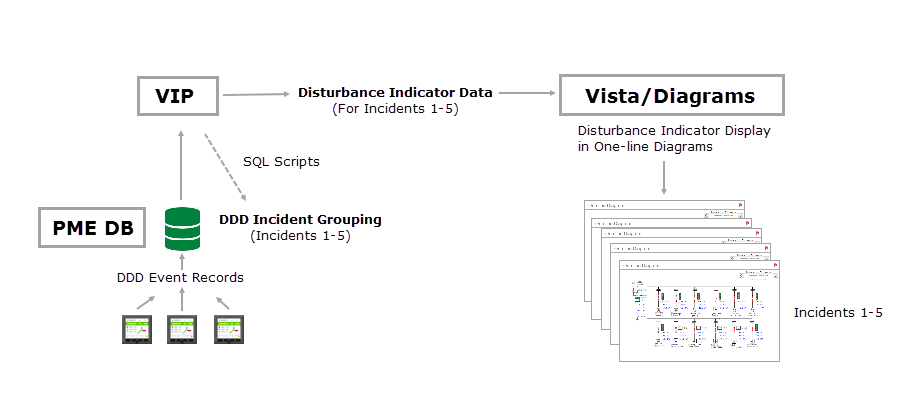
The voltage disturbance indicators in the electrical one-line diagram show the type of the disturbance (sag/swell/transient) and its direction, relative to the monitoring device (upstream/downstream). This information is based on DDD event records that are recorded by the devices and uploaded into the PME database. A VIP framework triggers database scripts that run every 5 minutes and scan the database for DDD event records, going back in time. Events that occurred within a short time interval (< 60s between events) are grouped together into an Incident. The scripts continue to scan for DDD events until 5 Incidents have been found, or the event data is older than 180 days. The DDD information for each of the Incidents is then processed by the VIP for display in the one-line diagram.
We create 5 identical copies of the one-line diagram, one for each disturbance Incident. The diagrams are linked together so you can navigate between them using the Incident Navigator.
Example: