Operation
After you have configured the application and created views in the Web Applications, you can monitor the busway temperature. The following are examples of temperature data displayed in the different Web Applications.
Dashboards:
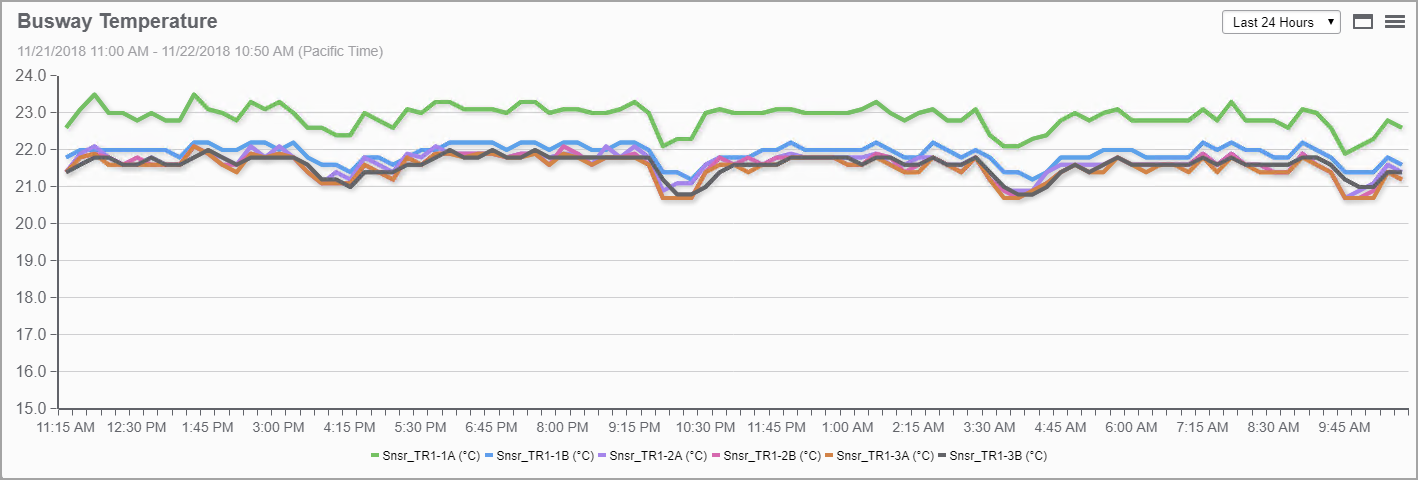
The above is an example of a dashboard showing busway temperature measurements for the last 24 hours.
Diagrams:
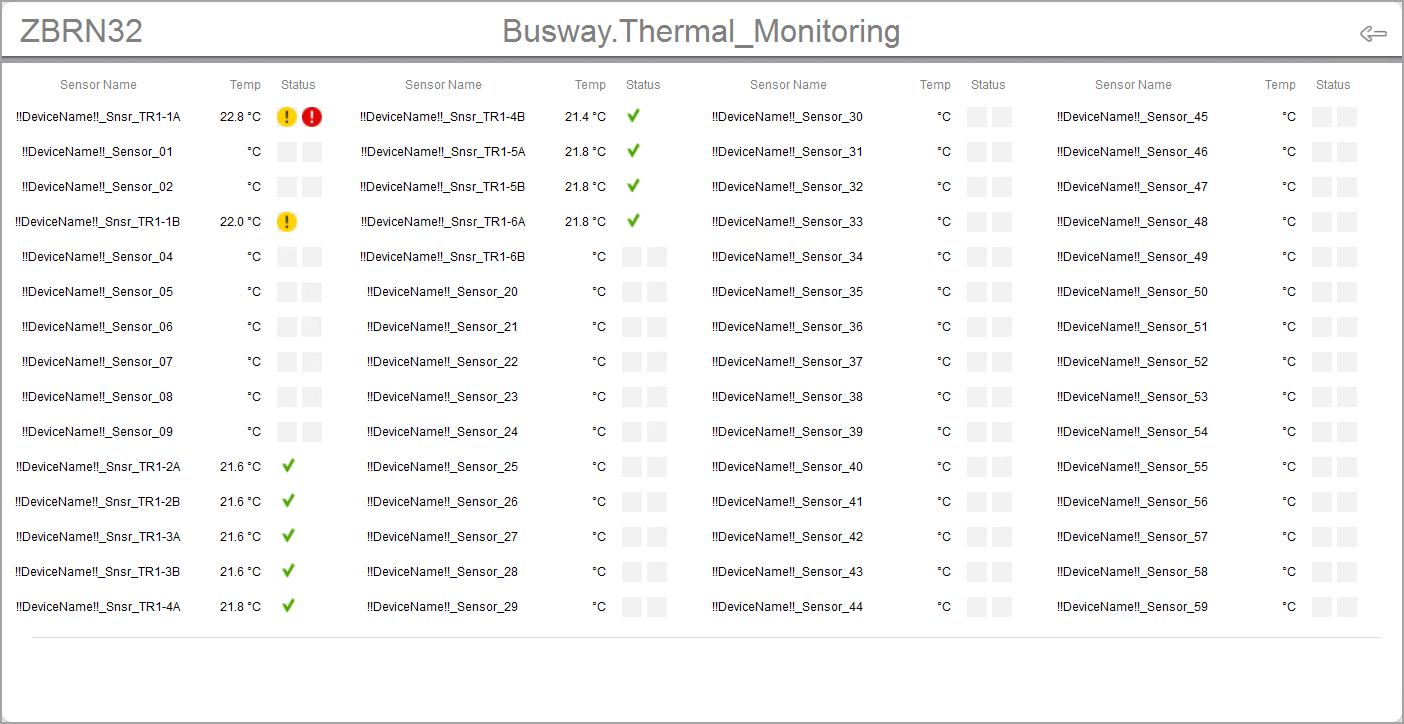
The above is an example of a diagram showing sensor data for a ZBRN32 access point.
Trends:

The above is an example of a real-time trend showing busway temperature over the last hour.
Alarms:
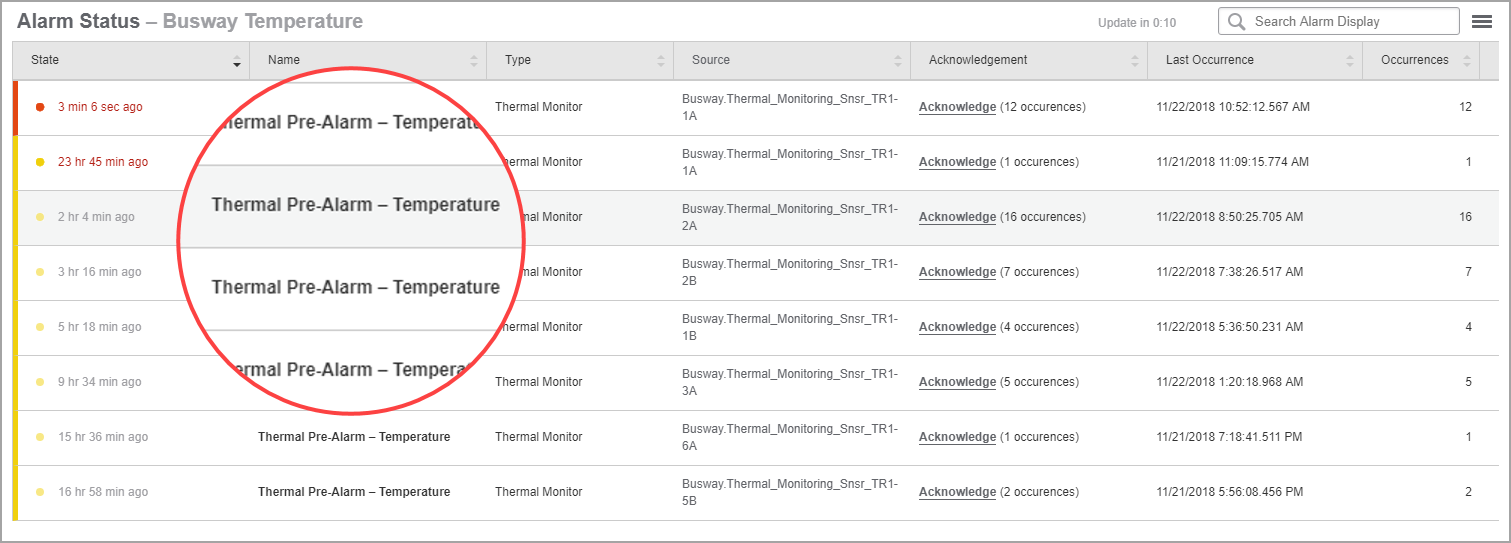
The above is an example of an alarm status view showing thermal monitoring related alarms.

The above is an example of an alarm incident view showing thermal monitoring related incidents.
Reports:

The above is an example of a trend report showing the busway temperature over the last 24 hours.
You can also generate Thermal Monitoring report. See Continuous Thermal Monitoring Report for more information.