Waveforms UI

Incident and alarm instance waveforms UI
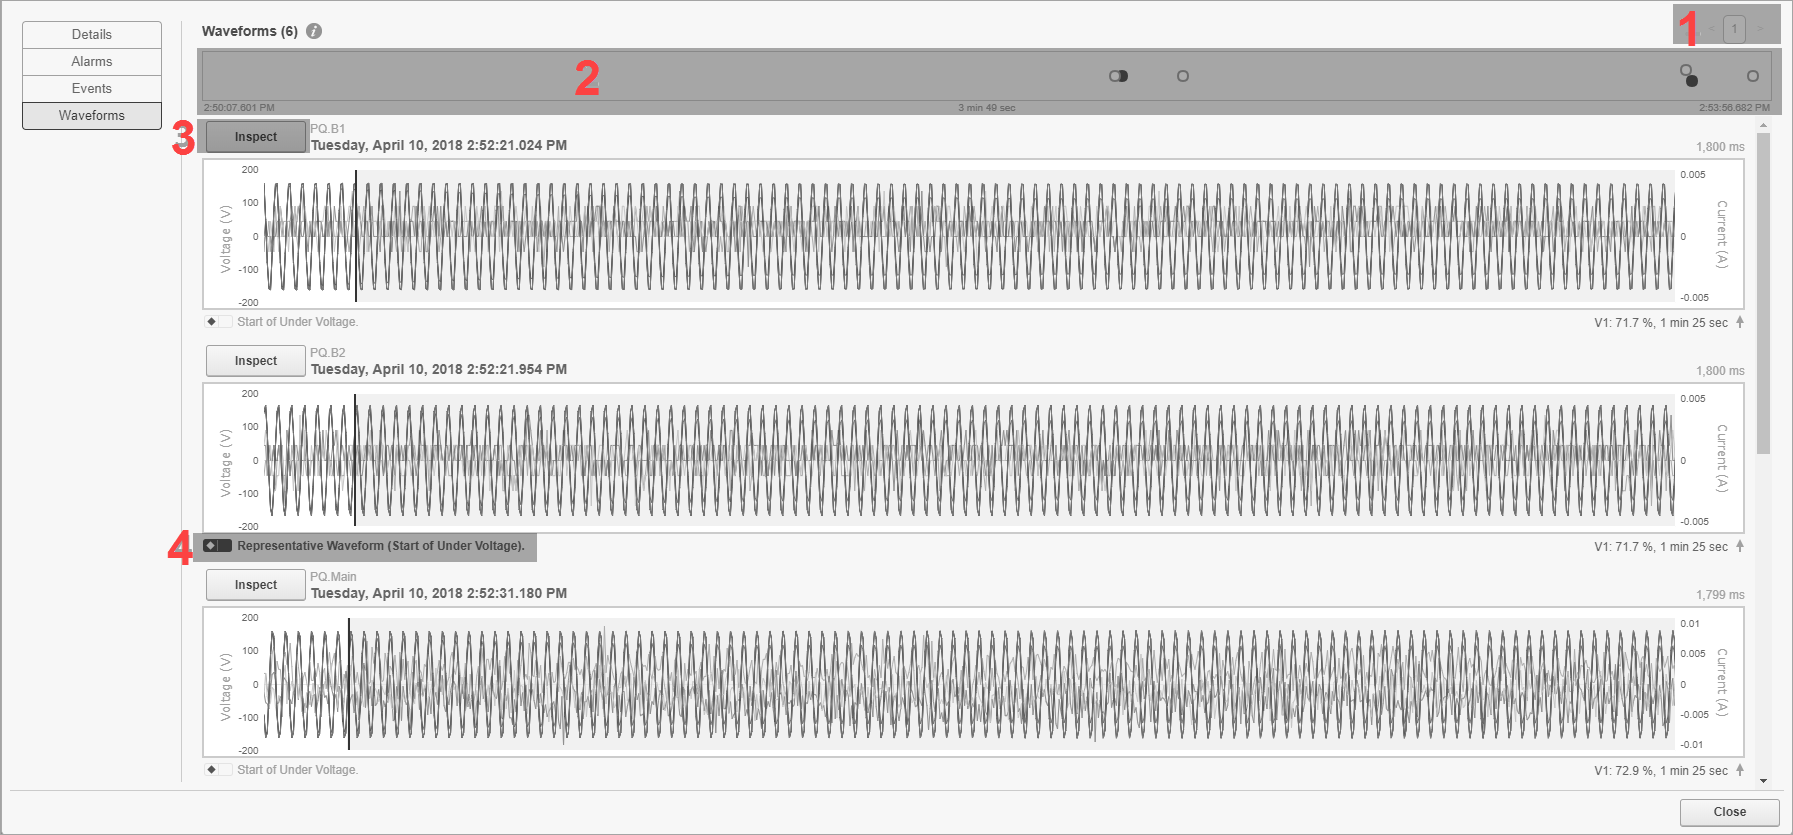
1 Page selector.
Navigate between pages.
2 Waveforms timeline.
The timeline shows at what point in time the waveforms that are associated with this incident or alarm instance were captured. Each waveform capture is represented by a dot. The representative waveforms for this incident or alarm instance are shown with black dots.
3 Inspect button
Click the button to open the waveform inspection window for this waveform.
4 Representative waveform
The black marking identifies the representative waveform for this incident or alarm instance. The representative waveform is the waveform for the worst disturbance in the incident or alarm instance.

Waveform inspection UI
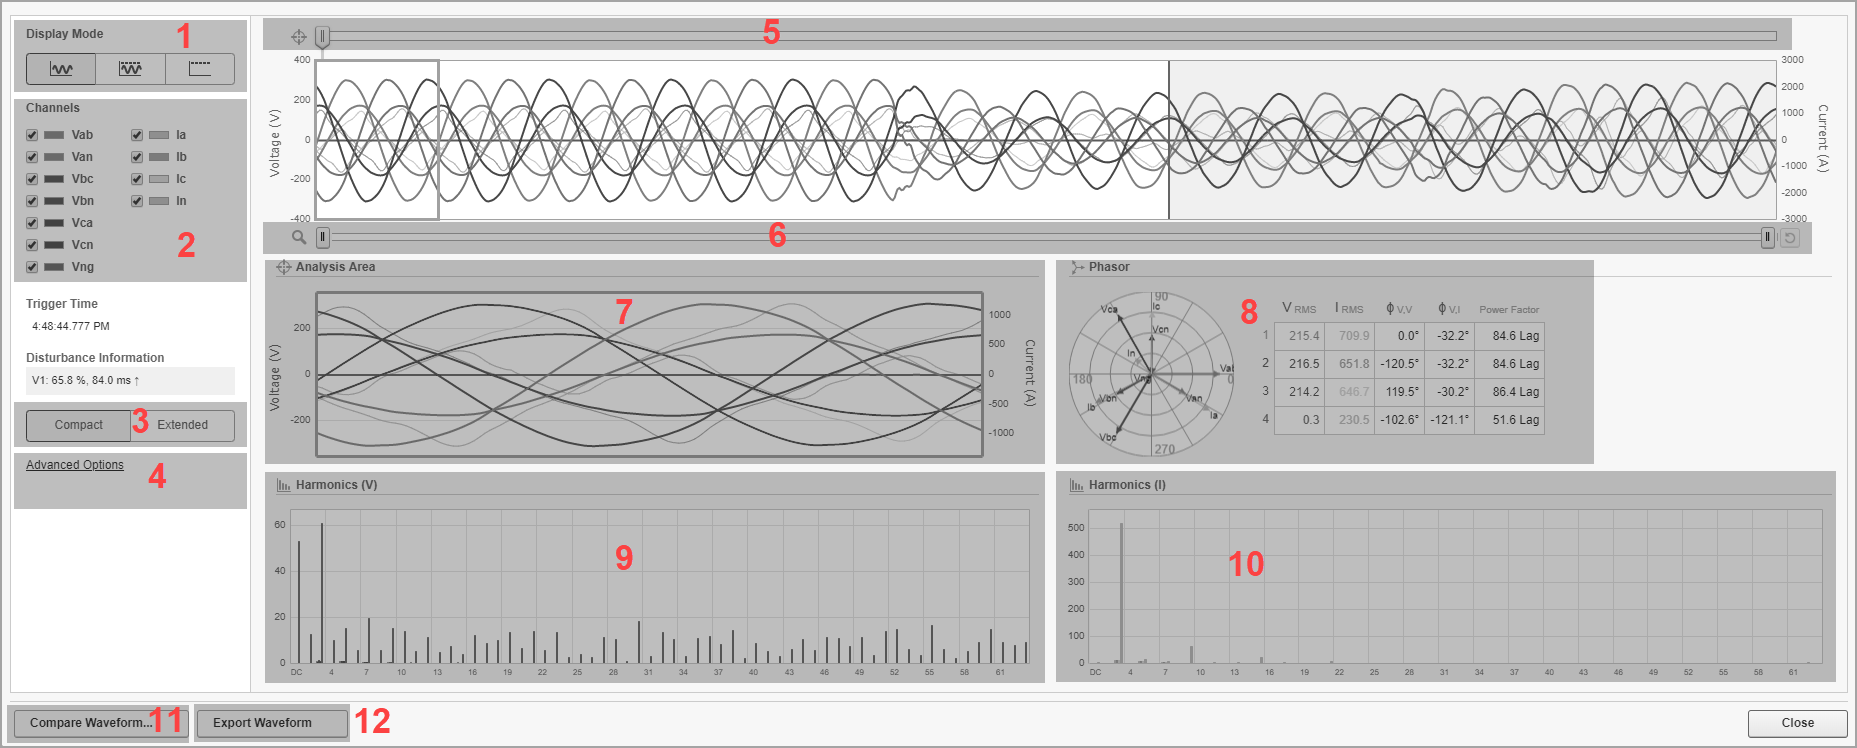
1

Display Mode
Select one of the following display modes for the waveform chart: Waveform, Waveform and RMS, RMS.

NOTE: The display mode selector is not available for high speed transient waveform captures.

2 Channels
Select which channels (V1, V2, V3, I1, I2, I3) to include or exclude from the waveform chart.
3

View type selector
Use the view type selector to switch between a Compact View and an Extended View. The Compact View groups the analysis charts together to fit the window size. The Extended View shows the charts below each other with a larger display area for each chart.

NOTE: The view type selector is not available for high speed transient waveform captures.
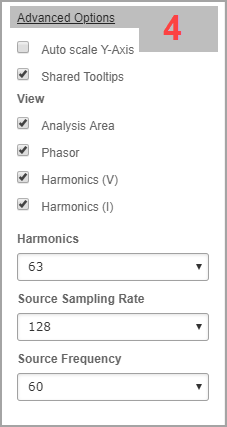
4

Advanced Options

TIP: The Advanced Options are hidden by default. Click the Advanced Options label to show or hide these settings.

Auto scale Y-Axis Auto scale adjusts the y-axis automatically as you zoom or pan the waveform plot.
Shared Tooltips

Shared tooltips display measurement details for all voltage and current phases as you move the pointer over the waveform plot. Non shared tooltips only display details for the voltage or current the pointer is hovering over.
Example: Hover the pointer over the Vab voltage waveform plot.
Shared Tooltips (shows all details)

Non Shared Tooltips (only shows Vab details)

View

Select which charts (Analysis Area, Phasors, Harmonics (V), Harmonics (I)) are shown in the analysis pane.

NOTE: The View option is not available for high speed transient waveform captures.

Harmonics

Set the number of harmonics to display in the harmonics column chart.

NOTE: The harmonics setting is not available for high speed transient waveform captures.

Source Sampling Rate

Select the sampling rate at which the waveform was captured. The sampling rate is detected automatically. Use this control to make adjustments if the sampling rate setting is incorrect. The sampling rate is set correctly when the analysis region covers one cycle of waveform capture.

NOTE: The sampling rate setting is not available for high speed transient waveform captures.

Source Frequency

Select the source frequency. The frequency is detected automatically. Use this control to make adjustments if the frequency setting is incorrect.

NOTE: The frequency setting is not available for high speed transient waveform captures.

5

Analysis area selector
Use the slider to select an analysis area in the waveform chart.

NOTE: The analysis area selector is not available for high speed transient waveform captures.

6 Zoom
Use the left and right sliders to zoom in and out of the waveform chart. You can also click and drag the pointer on the plot to zoom. To pan while zoomed in, click and drag the area between the sliders. Click to the right of the sliders to zoom out to the original size.
7

Analysis area chart
This chart shows the waveform signature of the section of the waveform that has been selected by the analysis area selector (see 5). The phasor and harmonics calculations are based on the waveform data from the analysis area. The y-axis is automatically scaled.

NOTE: The analysis area chart is not available for high speed transient waveform captures.

8

Phasor chart
This chart shows the phasor analysis of the section of the waveform that has been selected by the analysis area selector (see 5). Phasor details are shown in a polar diagram and a data table.

NOTE: The phasor chart is not available for high speed transient waveform captures.

9

Voltage harmonics chart
This chart shows the voltage harmonic analysis of the section of the waveform that has been selected by the analysis area selector (see 5). Harmonic details are shown in a column chart.

NOTE: The voltage harmonics chart is not available for high speed transient waveform captures.

10

Current harmonics chart
This chart shows the current harmonic analysis of the section of the waveform that has been selected by the analysis area selector (see 5). Harmonic details are shown in a column chart.

NOTE: The current harmonics chart is not available for high speed transient waveform captures.

11 Compare Waveforms
Use this option to open this waveform in a new, Compare Waveforms tab in the browser. You can then select other waveforms to open in the same window. If a Compare Waveforms tab is already open, then the present waveform is added to that window.
12

Export Waveform
Use this option to download the waveform data of the present waveform in .csv file format. The file is downloaded to your local Windows Downloads folder.