Creating a TGML Energy Usage Intensity map
An Energy Usage Intensity (EUI) map provides a way to visualize in real-time how the energy demand for each zone in your facility compares with four predefined limits. Each zone changes color to indicate the amount of energy currently being used based on setpoints. Typically, green indicates low energy consumption, while yellow to orange and up to red indicate increasingly higher to high energy usage.
The following steps describe how to create an EUI map for use with a floor plan:
Prerequisites:
- A floor plan image.
To add a floor plan:
- Open Graphics Editor.
- Select Insert Picture.
- Select your floor plan image.
The image is added to the TGML diagram.
To add EUI zones to the floor plan:
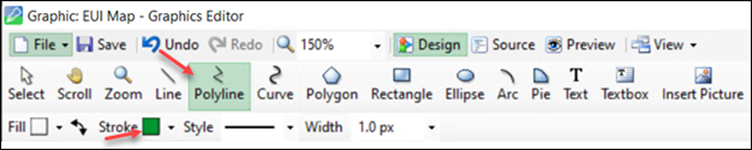
- Select the Polyline tool and set the Stroke color to Dark Green.
- Draw a polyline around the first zone on the floor plan. Ensure the polyline is completely enclosed.
- Select Properties.
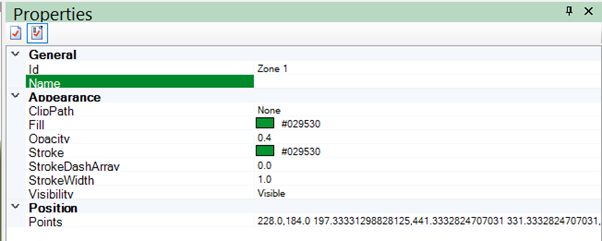
- Set the following properties for the polyline:
- Id: Enter an ID name that identifies the zone.
- Fill: Set the Fill color to match the Stroke.
- Opacity: Set Opacity to 0.4.
- Repeat steps 1-4 for each zone in the floor plan.
Confirm that the zone in the floor plan is overlaid in Dark Green.
To add a binding to each EUI zone:
- Select Objects > Polyline Objects, then right-click and select New > Bind.
- Select Properties.
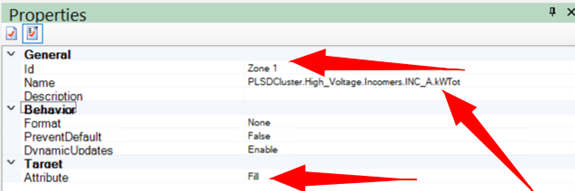
- Set the following properties for the bind:
- Id: Enter the same ID name given to the parent polyline.
- Name: Choose a real-time source to provide energy for the zone.
- Attribute: Set the Attribute to Fill.
- Repeat steps 1-3 to bind each zone in the floor plan.
To add color changing functionality to each EUI zone:
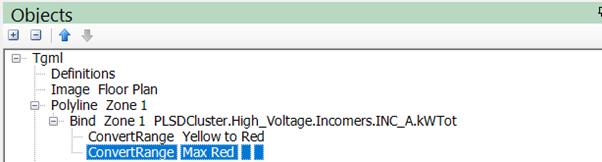
- Select Objects > Bind Objects > New > ConvertRange.
- Select Properties.
- Set the following properties for the ConvertRange:
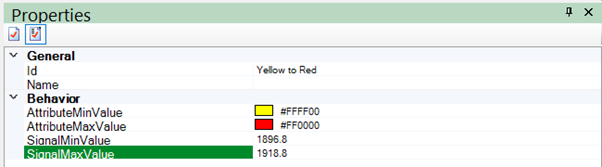
- Id: Yellow to Red
- AttributeMinValue: #FFFF00
- AttributeMaxValue: #FF0000
- Repeat steps 1-3 for each EUI zone.
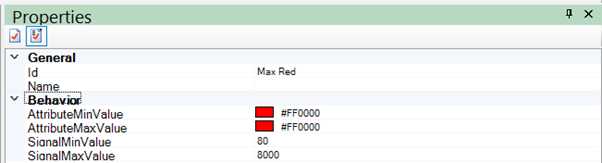
- Set the following properties for the ConvertRange:
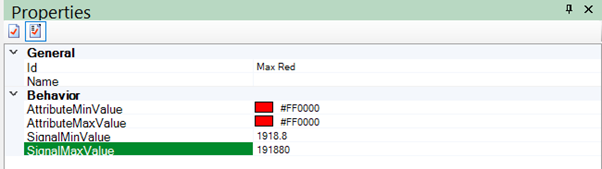
- Id: Max Red
- AttributeMinValue: #FF0000
- AttributeMaxValue: #FF0000
- For each remaining EUI zone binding, add the same two ConvertRanges by doing one of the following:
- Repeat steps 1-5.
- Select Objects, then copy the two ConvertRanges from the first EUI zone binding and paste it into the subsequent EUI zone bindings.
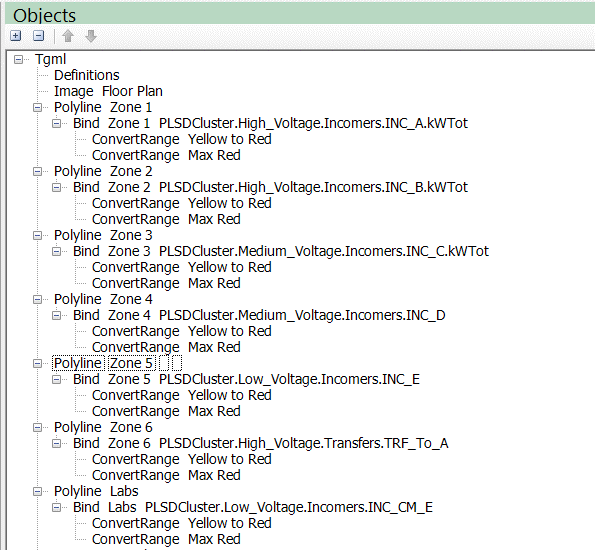
- In Objects, confirm that each polyline zone has a binding object and that each binding object has two ConvertRange objects.
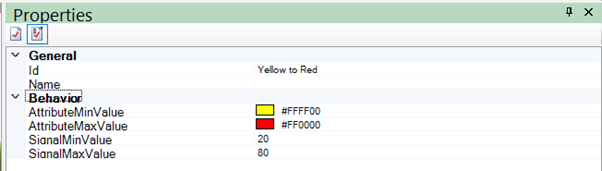
Each EUI zone changes color based on its energy usage, which is controlled by setting two threshold values:
- SignalMinValue: This indicates the average energy use. When the zone consumption goes above this value, the color changes from green to yellow.
- SignalMaxValue: This indicates the expected maximum energy use. When the zone consumption reaches this value, the color changes from yellow to red.
Color changing setpoints for each EUI zone can be based on custom reduction goals or trends.
To create a trend:
- In the WebHMI, navigate to Trends.
- Open the Trend Library and navigate to the folder within which you want to create a trend.
- Set the following trend parameters:
- Select a Source and Measurement that equates to those used for the zone on the EUI map.
- Select the Min, Max, and Mean Overlays.
- Select Historical data for the Data Source.
- Select 1 year for the Time Range.
- Select OK.
- Record the Mean and Max values.
- Navigate to Objects.
- Select an EUI zone's Yellow to Red ConvertRange.
- Set the following properties for the ConvertRange:
- SignalMinValue: Enter the Mean value from the trend.
- SignalMaxValue: Enter the Max value from the trend.
- Select an EUI zone's Max Red ConvertRange.
- Set the following properties for the ConvertRange:
- SignalMinValue: Enter the Max value from the trend.
- SignalMaxValue: Enter the Max value multiplied by 100 from the trend, or enter an equally large value that will never be reached.
- Repeat steps 1-10 for each remaining EUI zone.
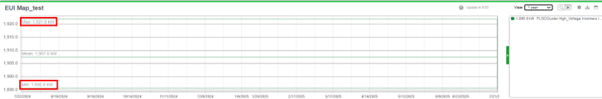
The trend with Mean and Max value appears.
To finalize the TGML EUI map, do the following:
- Complete the map by adding any necessary zone labels, real-time values, legends, etc.
- Save the TGML file.