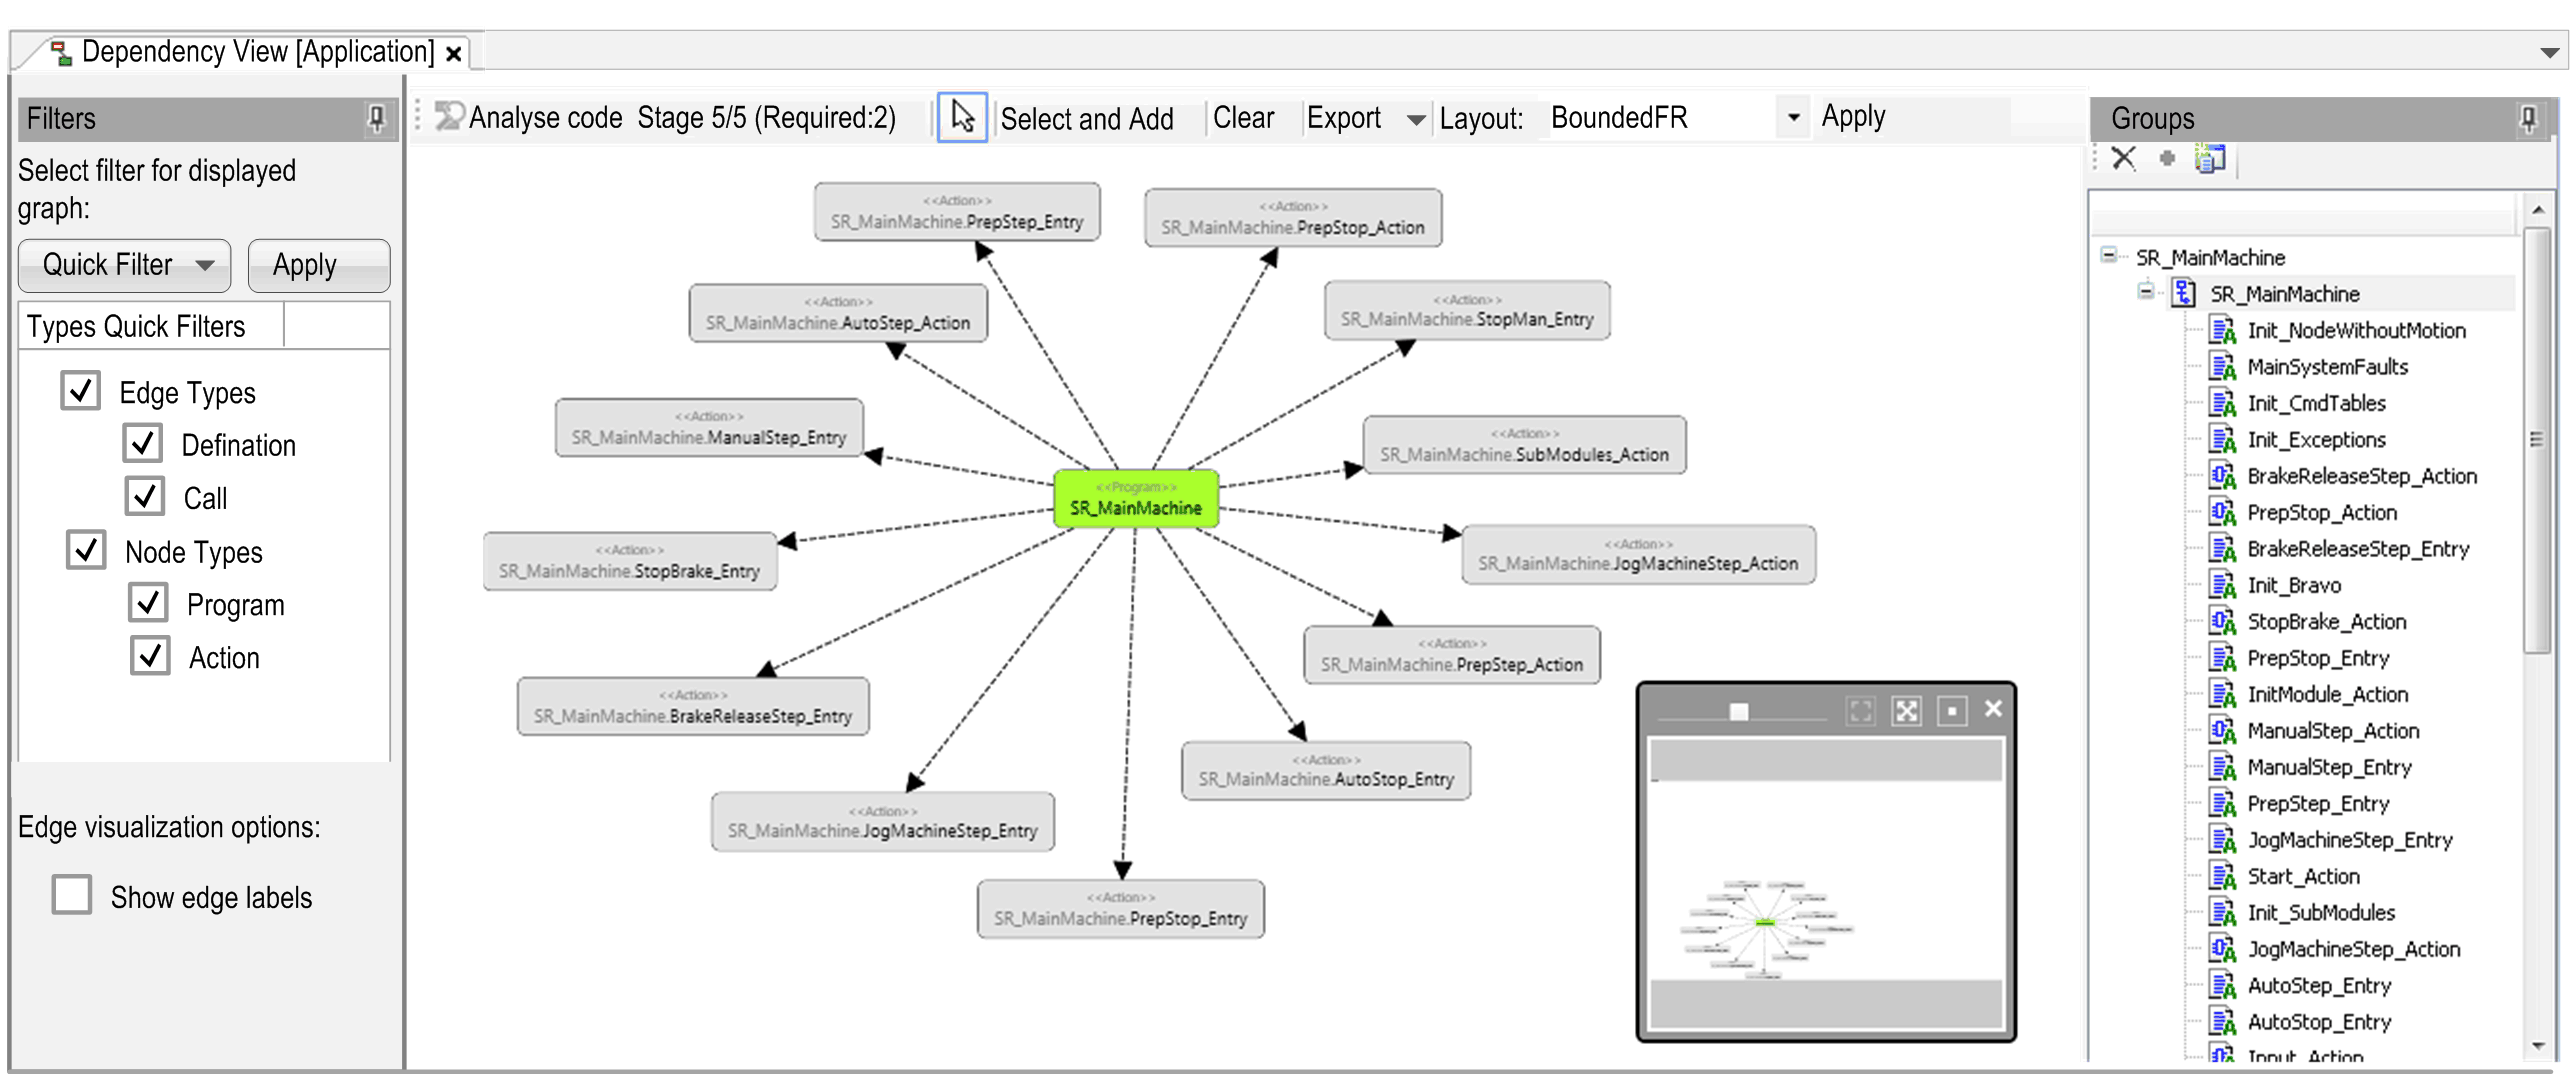
With the Dependency View, you can visualize the dependencies of your analyzed application as a dependency graph. You can select the content and the layout of the dependency graph.
The Dependency View provides three parts:
oFilters (left-hand side)
You can filter and configure the dependency graph.
oDependency Graph (main window)
The displayed graph represents dependencies between elements of the analyzed application.
oGroups (right-hand side)
You can structure the application using the Groups tree.