Signal_Saturation: Limiting to Upper and Lower Saturation Limit
Signal_Saturation Function Block
This figure shows the pin diagram of the Signal_Saturation function block:

The Signal_Saturation function block limits the input signal to upper and lower saturation limit.
When low input value is more than the high value then the detected error output is TRUE and the output displays zero.
When the input exceeds the low/high input limit value, then q_xIputLimExcd is TRUE.
This table describes the input pins of the Signal_Saturation function block:
|
Input |
Data Type |
Description |
|---|---|---|
|
i_rIput |
REAL |
Input value Range: ±3.4e+38 |
|
i_rLow |
REAL |
Lower input value Range: ±3.4e+38 |
|
i_rHigh |
REAL |
Higher input value Range: ±3.4e+38 |
|
i_xErrRst |
BOOL |
Reset the detected error. (On rising edge) (Optional) |
This table describes the output pins of the Signal_Saturation function block:
|
Output |
Data Type |
Description |
|---|---|---|
|
q_rOput |
REAL |
Output value ±3.4e+38 |
|
q_xIputLimExcd |
BOOL |
TRUE: Input value exceed limit value. |
|
q_xErr |
BOOL |
TRUE: Input limit wrong FALSE: No detected error |
Instantiation and Usage Example
This figure shows an instance of the Signal_Saturation function block:

If input i_rIput is set to 4, i_rLow is set to 5 and i_rHigh is set to 10, then saturation output i_rLow value is 5 & q_xIputLimExcd is TRUE.
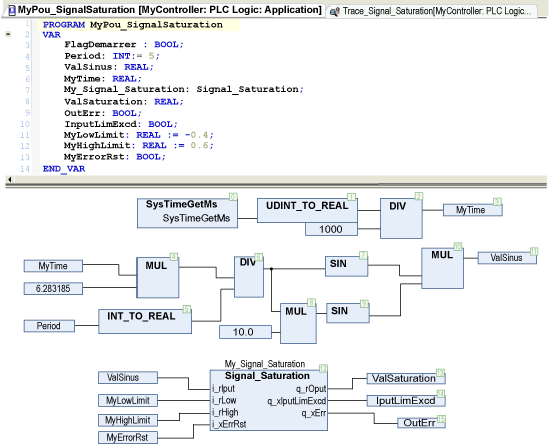
This figure shows the CFC example on Signal_Saturation implementation:

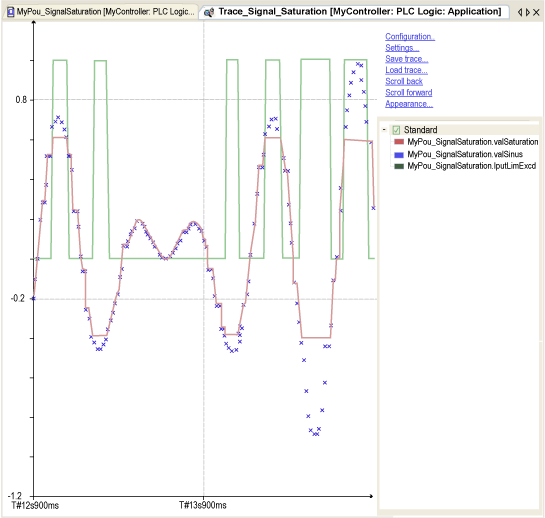
This figure shows the timing diagram for the Signal_Saturation function block:

Blue input signal
Red output signal, limited in the range [Low ; High]/[-0,4 ; +0,6].
Green IputLimExcd, TRUE when the input signal is out of the range.
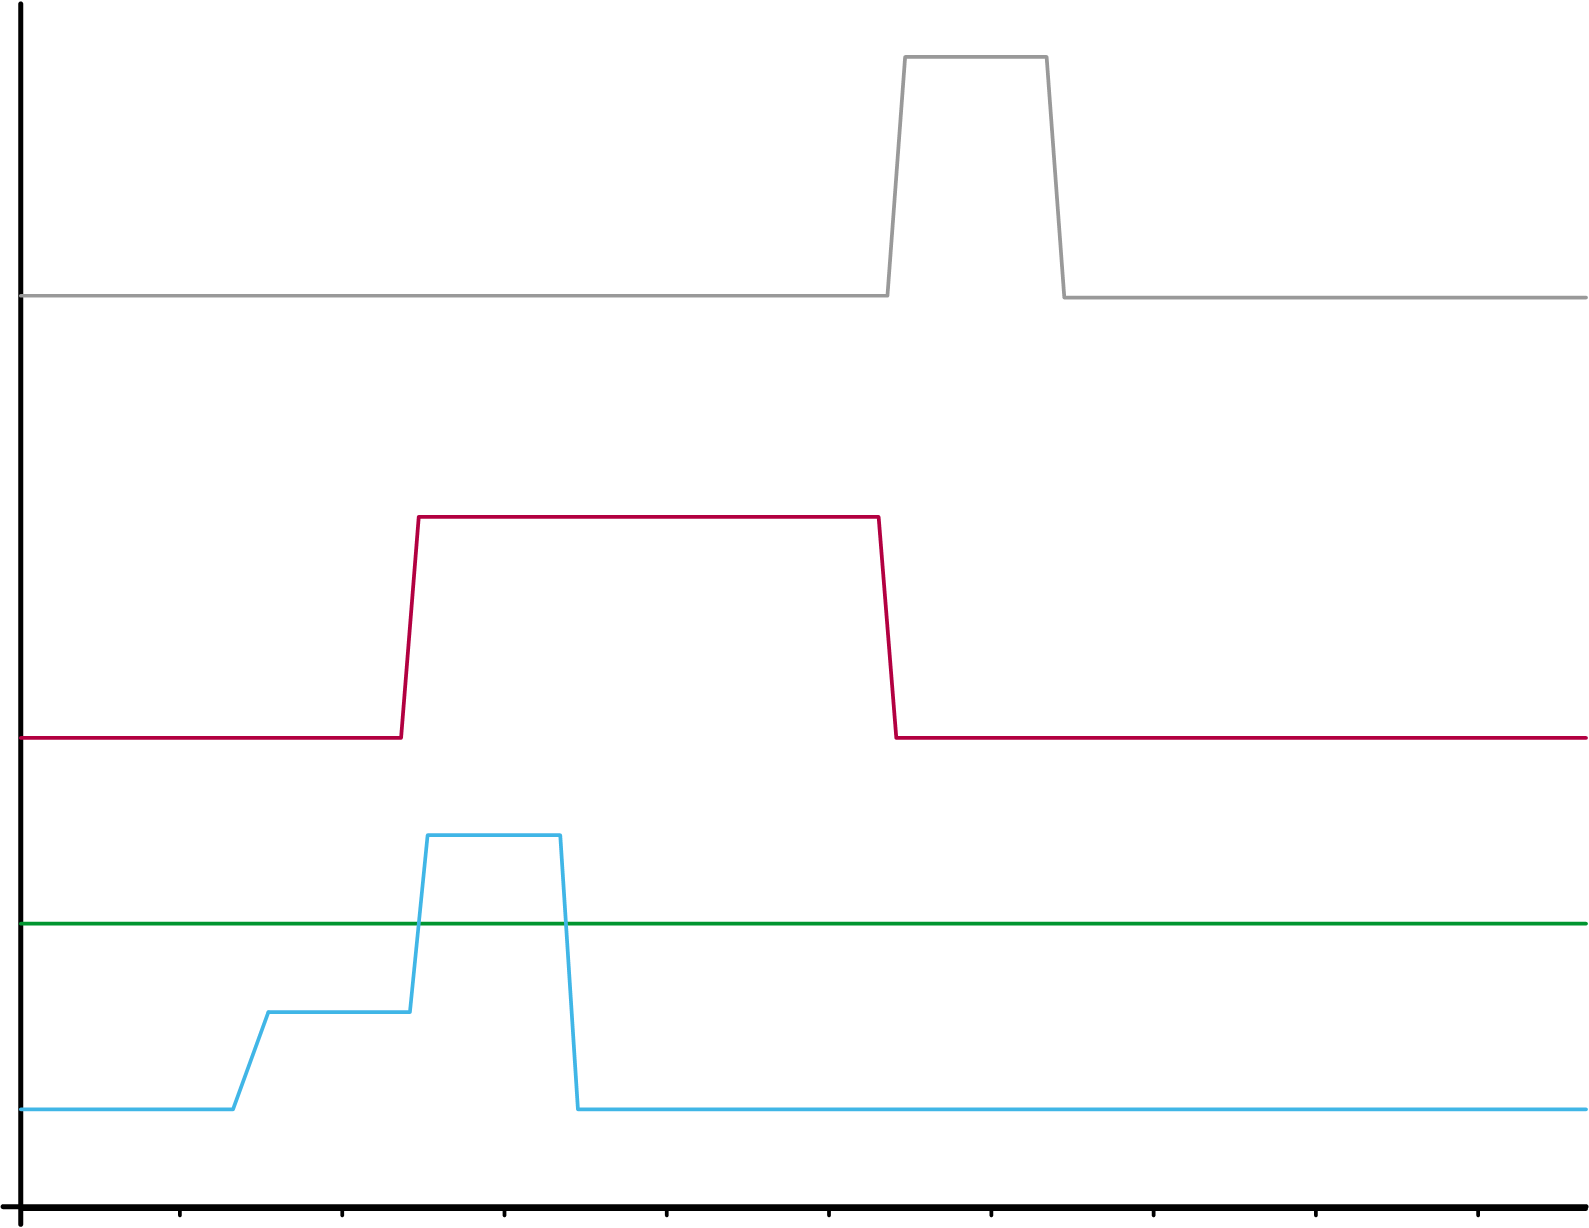
This figure shows the timing diagram of q_xErr output:

Blue: i_rLow input signal
Green: i_rHigh input signal
Red: q_xErr output signal, TRUE as soon as i_rLow is higher than i_rHigh.
Gray: i_xErrRst input signal, reset the q_xErr output signal on rising edge while i_rLow is lower than i_rHigh.