Signal_Statistics: Calculating Maximum, Minimum, Average and Variance
Signal_Statistics Function Block
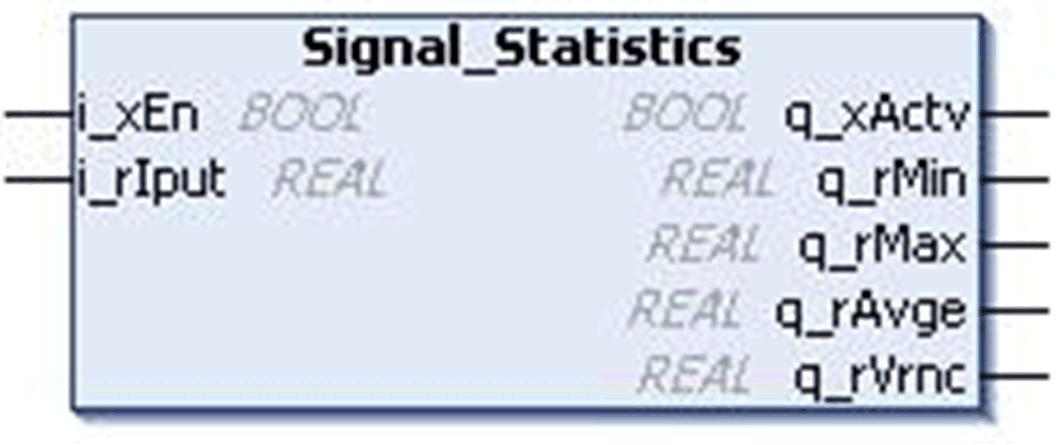
This figure shows the pin diagram of the Signal_Statistics function block:

This function block calculates the maximum, minimum, average and variance of a series of input values.
This function block considers the input value in each controller scan cycle as a Sample.
Minimum Output value is the value which is minimum amongst all the recorded samples.
Maximum Output value is the value which is maximum amongst all the recorded samples.
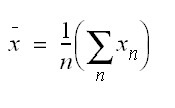
The average value is equal to the sum of the observations (samples) divided by the number of observations (samples).

Where:
on = Number of samples recorded
oXn = Input samples
o = Calculated output
The variance is equal to the mean of the squares of samples minus the square of the mean (Average output value).

Where:
on = Number of samples recorded
oXn = Input samples
o  = Calculated output
oStatistics (Enable: = TRUE, Input: = 1, 2
oMinimum Output =1
oMaximum Output = 2
oAverage = (1 + 2) / 2 = 1.5
oVariance = ((1 * 1 + 2 * 2) / 2) - (1.5 * 1.5) = 2.5 - 2.25 = 0.25
This table describes the input pins of the Signal_Statistics function block:
|
Input |
Data Type |
Description |
|---|---|---|
|
i_xEn |
BOOL |
TRUE: FB enabled FALSE: FB Disabled |
|
i_rIput |
REAL |
Bit position Range: ±3.4e+38 |
This table describes the output pins of the Signal_Statistics function block:
|
output |
Data Type |
Description |
|---|---|---|
|
q_xActv |
BOOL |
FB status output |
|
q_rMin |
REAL |
Minimum value Range: ±3.4e+38 |
|
q_rMax |
REAL |
Maximum value Range: ±3.4e+38 |
|
q_rAvge |
REAL |
Average value Range: ±3.4e+38 |
|
q_rVrnc |
REAL |
Variance value Range: ±3.4e+38 |