FUNCTION_BLOCK CHARCURVE
Maps an input signal onto a characteristic curve
The characteristic curve is given by an array of POINTs, which include a set of X-values with their corresponding Y-values.
Example in ST:
VAR
CHARACTERISTIC_LINE:CHARCURVE;
KL:ARRAY[0..10] OF POINT := [(X:=0,Y:=0),(X:=250,Y:=50),
(X:=500,Y:=150),(X:=750,Y:=400), 7((X:=1000,Y:=1000))];
COUNTER : INT;
END_VAR
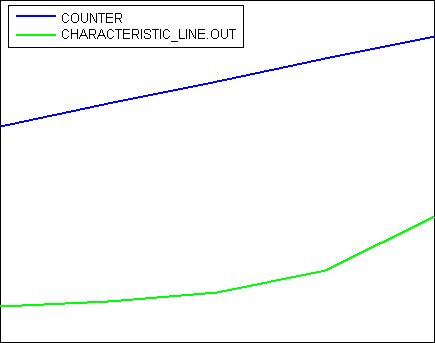
COUNTER := COUNTER+10; supply CHARCURVE with for example a constantly increasing value
CHARACTERISTIC_LINE(IN := COUNTER,N := 5,P := KL);
Illustration of the resulting curve

InOut:
|
Scope |
Name |
Type |
Comment |
|
Input |
IN |
INT |
Input signal |
|
N |
BYTE |
Number of points defining the characteristic curve : 2 <= N <= 11 |
|
|
Inout |
P |
ARRAY [0..10] OF POINT |
Array of points to describe the characteristic curve |
|
Output |
OUT |
INT |
Output variable, contains the manipulated value |
|
ERR |
BYTE |
0 : No error 1 : Error in P: wrong sequence (completely tested, only if IN is equal to largest X-value of P) 2 : IN outside of limits of P 4 : N invalid, number of points not within the allowed range 2..11 |