Configuring and Reproducing Visualization Elements as Templates
You can use the Visualization ‣ Multiply visu element command to create all of these elements automatically in a visualization that contains many elements of the same type with similar properties.
The command is applied to a visualization element that is used as a template for reproduction. You configure a property of the template element by means of an array variable with index placeholders. After reproduction, every element in this property will be configured with an indexed array value instead of the placeholder. Moreover, this is that property in which the visualization elements differ. The other properties of the template element are copied and are the same for all elements after reproduction.
After executing the command, the visualization contains one field of the same type of elements of one type according to the template. Moreover, the field of elements visualizes a common array variable – also several with the same and compatible dimension if needed. The command does the paperwork for you and automatically indexes the array value.
To configure an element so that it can be used as a template element, observe the following.
When you configure an element as a template:
You must define an array variable in at least one element property and use the index placeholder $FIRSTDIM$, and optionally $SECONDDDIM$.
Assign a fixed value to a property that is the same for all elements. (For example, a specific frame color that all multiplied elements should have.)
In the text of the template element, you can use placeholders as usual for displaying the values of variable (example: %s for the output text).
In special cases, you can define an array available across several dimensions by means of the index access placeholder.
Example
PROGRAM Main
VAR
strArra4Dim[1..10, 0..5, 5..10, 1..10] OF STRING;
END_VAR
Configured: Main.strArr4Dim[5, $FIRSTDIM$, $SECONDDIM$, 10]
In addition, you can configure an element with any number of arrays that all need to have the same structure. The same structure means the same declaration of index ranges.
Visualization elements that can be multiplied:
Rectangle
Round rectangle
Ellipse
Line
Polygon
Polyline
Bézier curve
Image
Frame
Button
Pie
Spin
Text field
Check box
Image switcher
Lamp
Dip switch
Power switch
Push switch
Push switch LED
Rocker switch
Rotary switch
Configuring and multiplying visualization elements as templates
Requirement: A visualization is open in a CODESYS project.
Drag a Rectangle element from the ToolBox view (Basic label) to the visualization.
Set the color "Red" for the property Colors ‣ Frame color and the color "Gray" for the property Colors ‣ Fill color .
Declare in program code arrays with which you can configure the following properties regardless of element: Text variables ‣ Text variable , Text variables ‣ Tooltip variable , and Inputconfiguration.
⇒
PROGRAM PLC_PRG
VAR
strArr2Dim: ARRAY[1..5,2..10] OF STRING :=
[ '1A', '2A', '3A', '4A', '5A',
'1B', '2B', '3B', '4B', '5B',
'1C', '2C', '3C', '4C', '5C',
'1D', '2D', '3D', '4D', '5D',
'1E', '2E', '3E', '4E', '5E',
'1F', '2F', '3F', '4F', '5F',
'1G', '2G', '3G', '4G', '5G',
'1H', '2H', '3H', '4H', '5H',
'1I', '2I', '3I', '4I', '5I' ];
strArr2DimTt: ARRAY[1..5,2..10] OF STRING :=
[ '1ATt', '2ATt', '3ATt', '4ATt', '5ATt',
'1BTt', '2BTt', '3BTt', '4BTt', '5BTt',
'1CTt', '2CTt', '3CTt', '4CTt', '5CTt',
'1DTt', '2DTt', '3DTt', '4DTt', '5DTt',
'1ETt', '2ETt', '3ETt', '4ETt', '5ETt',
'1FTt', '2FTt', '3FTt', '4FTt', '5FTt',
'1GTt', '2GTt', '3GTt', '4GTt', '5GTt',
'1HTt', '2HTt', '3HTt', '4HTt', '5HTt',
'1ITt', '2ITt', '3ITt', '4ITt', '5ITt' ];
boolArr2Dim: ARRAY[1..5,2..10] OF BOOL;
END_VAR
Configure the template element Rectangle with an array by specifying the array name in Text variables ‣ Text variable . Replace the first dimension with the placeholder $FIRSTDIM$ and the second dimension with the placeholder $SECONDDIM$. Example: PLC_PRG.strArr2Dim[$FIRSTDIM$, $SECONDDIM$].
Configure the property Texts ‣ Text with the placeholder %s.
⇒ The output text of the template element is now configured with an array. The visualization will generate text at runtime depending on the index.
Perform step 4 as for the property Text variables ‣ Tooltip by specifying the array PLC_PRG.strArr2DimTt[$FIRSTDIM$, $SECONDDIM$].
Configure the property Texts ‣ Tooltip with the placeholder %s.
⇒ The tooltip of the template element is now configured with an array. The visualization will generate text at runtime depending on the index.
Configure the template element with an array by specifying the name of an array (BOOL) in Inputconfiguration ‣ OnMouseClick , type Toggle variable (example: PLC_PRG.boolArr2Dim[$FIRSTDIM$, $SECONDDIM$]).
⇒ The input configuration of the rectangle is now configured. At runtime, you can click every rectangle.
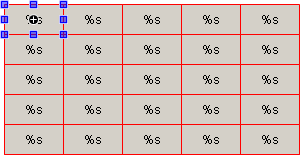
Click Visualization ‣ Multiply visu element .
⇒ The Multiply visu element dialog opens. The values in Total number of elements are already selected according to the configured array.
Click OK to confirm the selection.
⇒ Visualization:
