Displaying Structured Variable Values in Tables
Subsequent instructions describe an example of how an array of a structure is displayed in a table. To prepare, create the MyStruct DUT and the declarations in the PLC_PRG program.
TYPE MyStruct :
STRUCT
iNo : INT;
bOnStock : BOOL;
strPartNumber : STRING;
END_STRUCT
END_TYPE
PROGRAM PLC_PRG
VAR
arrStruct : ARRAY[0..6] OF MyStruct;
iSelectedColumn : INT;
END_VAR
Drag the Table visualization element to the visualization editor.
Assign the array variable arrStruct to the Data array property.
⇒ The structure components are displayed as column headers and the array index is as row headings.
Change the property Columns ‣ Column ‣ [0] ‣ Column header to an informative header (example: Number).
Change the header of column [1] to in stock and column [2] to Part number. Adjust the column width.
Assign a color to the property Selection ‣ Selection color .
Define the property Selection ‣ Selection type as row selection.
Define the variable PLC_PRG.iSelectedColumn for the property Selection ‣ Variable for row selection .
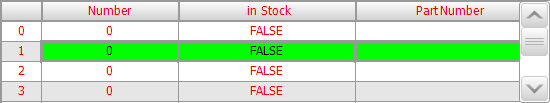
⇒ The following display results in online mode:
See also