MC_Halt_PTO: Command a Controlled Motion Stop until the Velocity equals Zero

To see the general representation in IL or ST language, refer to the chapter Function and Function Block Representation.
This table describes the input variables:
|
Input |
Type |
Initial Value |
Description |
|---|---|---|---|
|
Axis |
AXIS_REF_PTO |
- |
Name of the axis (instance) for which the function block is to be executed. In the devices tree, the name is declared in the controller configuration. |
|
Execute |
BOOL |
FALSE |
On rising edge, starts the function block execution. On falling edge, resets the outputs of the function block when its execution terminates. |
|
Deceleration |
DINT |
20 |
Deceleration in Hz/ms or in ms (according to configuration). Range (Hz/ms): 1...MaxDecelerationAppl Range (ms): MaxDecelerationAppl...100,000 |
|
BufferMode |
MC_BUFFER_MODE |
mcAborting |
|
|
JerkRatio1 |
INT |
0 |
Percentage of deceleration from constant velocity used to create the S-curve profile. |
|
JerkRatio2 |
INT |
0 |
Percentage of deceleration to standstill used to create the S-curve profile. |
This table describes the output variables:
|
Output |
Type |
Initial Value |
Description |
|---|---|---|---|
|
Done |
BOOL |
FALSE |
If TRUE, indicates that the function block execution is finished with no error detected . |
|
Busy |
BOOL |
FALSE |
If TRUE, indicates that the function block execution is in progress. |
|
Active |
BOOL |
FALSE |
The function block controls the Axis. Only one function block at a time can set Active TRUE for a defined Axis. |
|
CommandAborted |
BOOL |
FALSE |
Function block execution is finished, by aborting due to another move command or an error detected . |
|
Error |
BOOL |
FALSE |
If TRUE, indicates that an error was detected. Function block execution is finished. |
|
ErrorId |
PTO_ERROR |
PTO_ERROR.NoError |
When Error is TRUE: type of the error detected . |
NOTE: The function block completes with velocity zero.
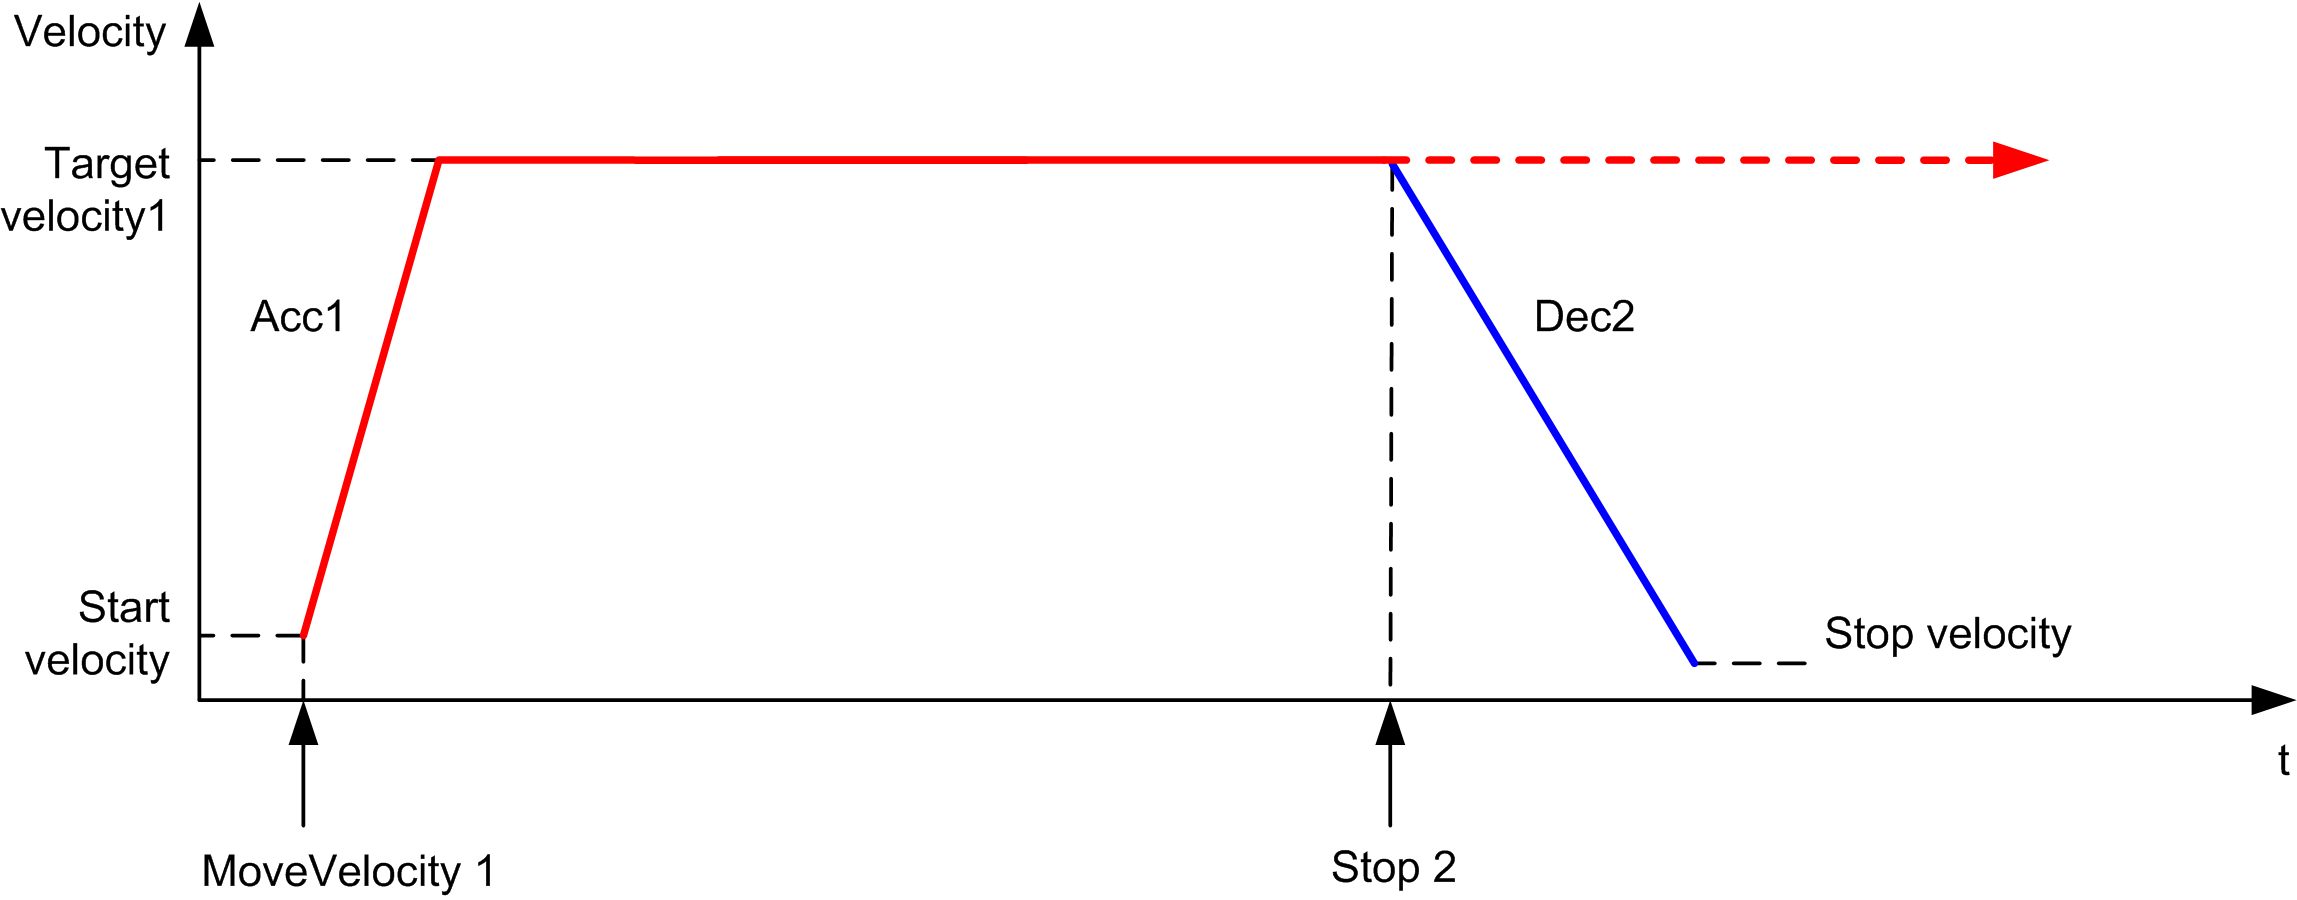
The diagram illustrates a simple profile from Continuous state:

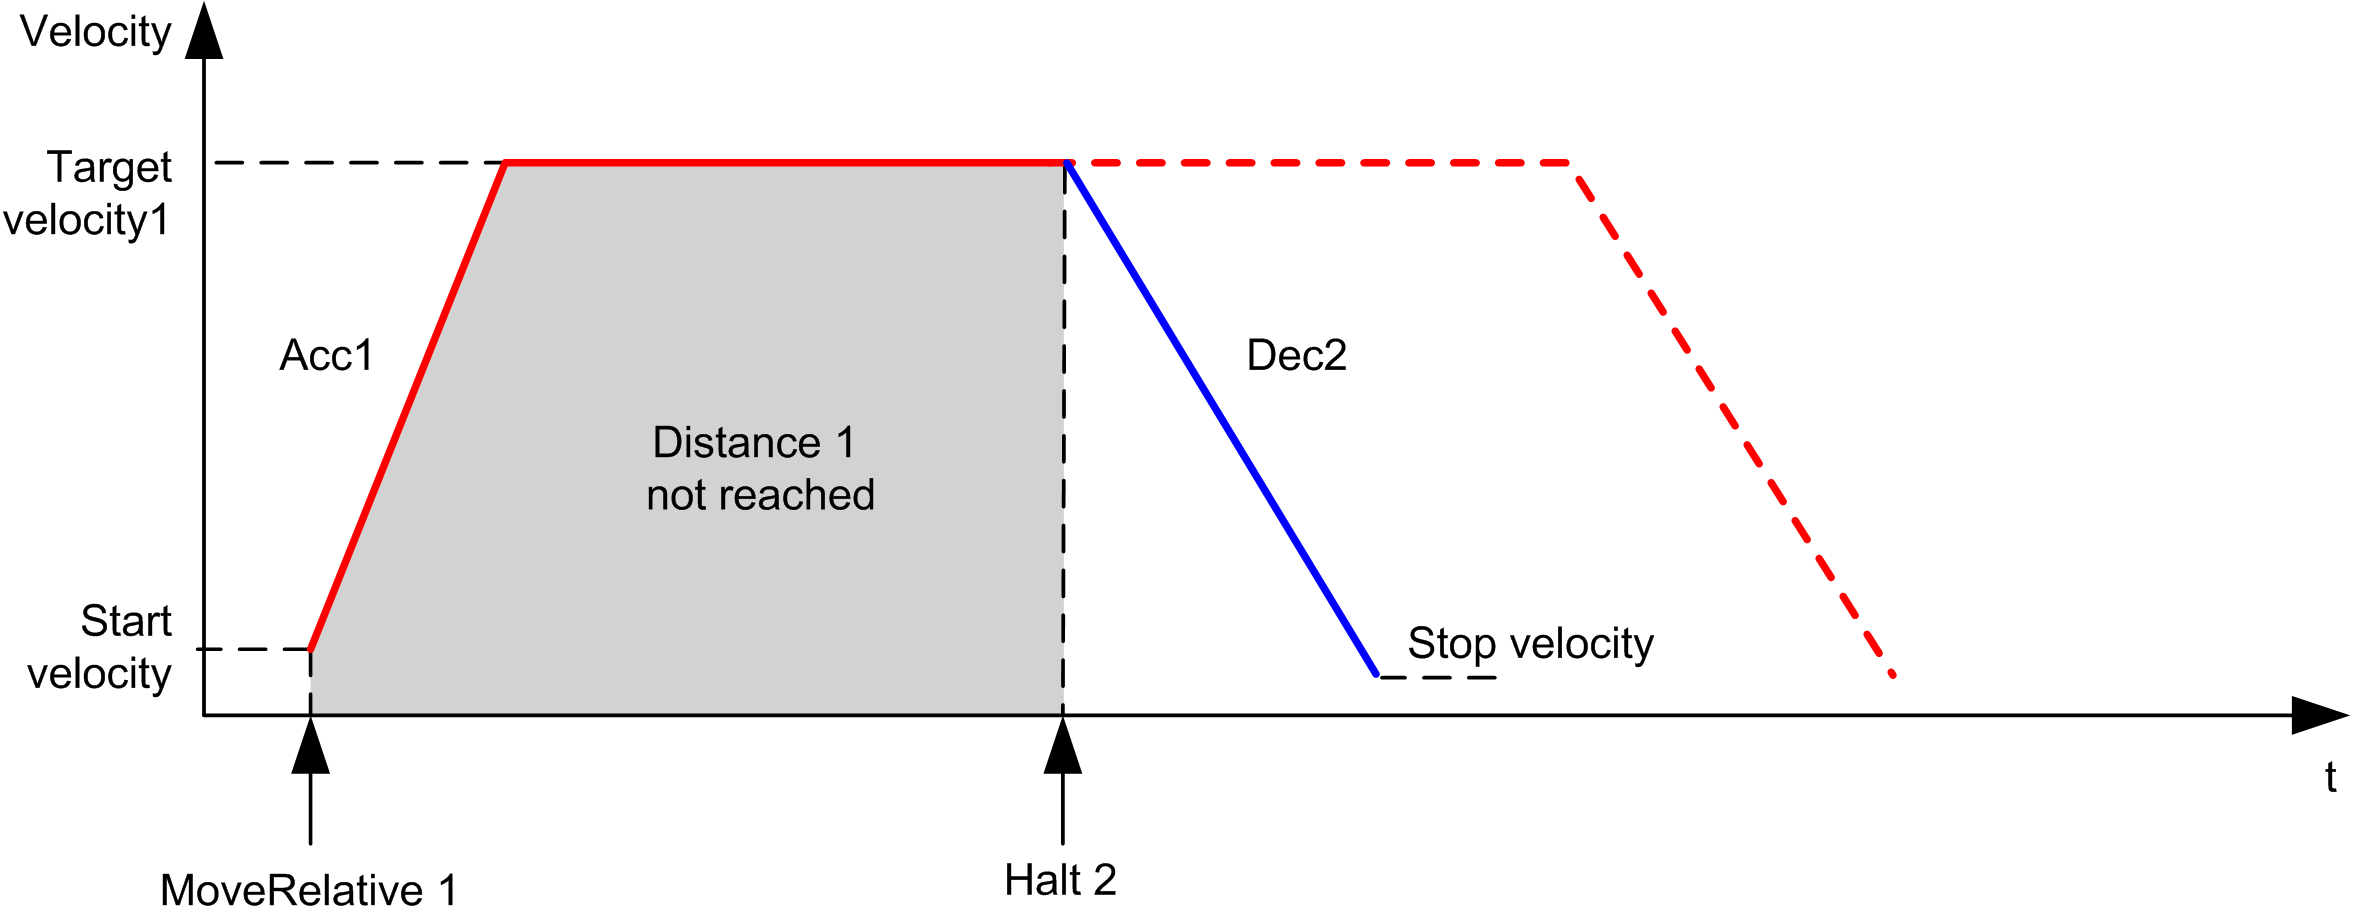
The diagram illustrates a simple profile from Discrete state:
