Calling Function Blocks and Start Trigger
Calling the Function Blocks
Call the function blocks (FB_SamplingDataAsynchron or FB_SamplingDataRealTime) from the main task or a lower priority task.
Calling the Start Trigger
Once the function block is enabled and ready for operation, the sampling process can be started by the property xStartSampling provided by the function block. This allows you to start the sampling process from a different task than the task where the function block is called. This can be an External task, if required by your application.
If you have configured a task of type External for triggering the property xStartSampling, consider that the event MDT_WRITE_ACCESS increases the delay for starting the sampling process by an additional Sercos cycle.
To reduce the delay to the minimum of 2 Sercos cycles + 250 μs, select an External event different than MDT_WRITE_ACCESS.
For further information about task configuration, refer to the Configuration of a Specific Task.
Behavior of the Property xStartSampling
Upon a rising edge at the property xStartSampling, the sampling process is initiated. The function block must be preconditioned and ready for operation and there must be no sampling process running.
You can stop a running sampling process by setting the input i_xEnable of the function block to FALSE. Doing so, all present sampled data are deleted.
While the sampling process is in progress, an Online Change of the application cannot be performed. The sampling process is outsourced to a separate task. As long as this task is not completed, a requested online change is rejected. If this is the case, Logic Builder issues a message informing you that an online change cannot be performed.
Displaying Sampled Data in a Trace Plot
To display sampled data in a trace plot in EcoStruxure Machine Expert, proceed as follows:
|
Step |
Action |
|---|---|
|
1 |
Right-click the node of the controller that is sampling data in the Devices tree and execute the command from the contextual menu. |
|
2 |
Enter a name for the device trace and click Add. Result: A new device trace node is created as a subnode of the selected controller and the DeviceTrace editor opens on the right-hand side. |
|
3 |
Right-click in the DeviceTrace editor and execute the command Online List. Result: The Online list dialog box opens that displays the traces that are existing on the device. |
|
4 |
Select the function block that is sampling data and click the Upload command. Result: The selected trace is uploaded from the runtime system. |
|
5 |
Click OK to close the Online list dialog box. Result: The sampled data are displayed as trace plot in the DeviceTrace editor. |
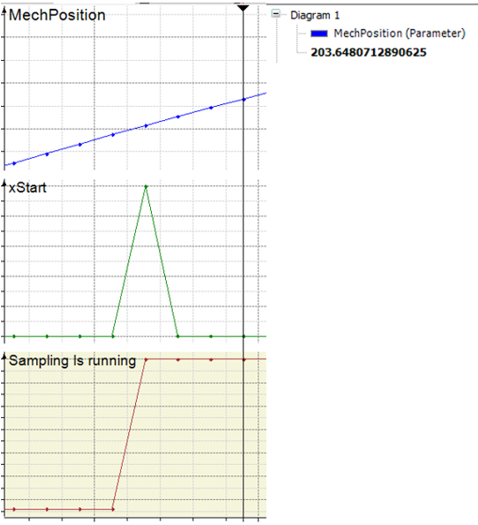
Based on the MechPosition, a delay of 2 Sercos cycles + 250 μs is applied after the sampling process has been started.
|
The graphs illustrate the trace recording of MechPosition and the start of the sampling process: |
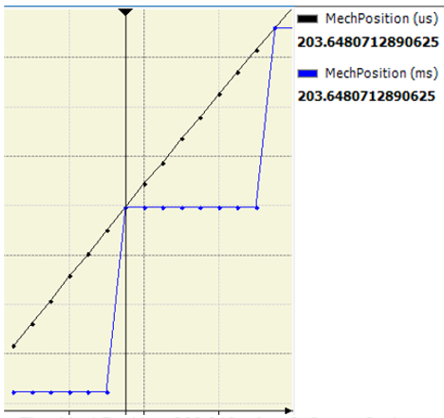
The graphs illustrate a magnified section of the same MechPosition in a trace plot after the sampling process has been started: |
|
|
|
|