Specific Information for PacDrive M Controllers
Overview
The Sercos view described in this chapter only applies to PacDrive M with firmware version superior or equal to V00.16.40 and inferior to V01.00.00.
The topology describes the arrangement of devices and their connections to one another to help to ensure collective data exchange.

When shutting down the controller, the data is lost. If the expected devices are not shown in the graphic, verify the following:
-
Is there a ring interruption?
-
Has a value greater than 1 been entered in the parameter ?
-
Has an error been detected for the parameter of the Sercos bus?
-
Are only virtual devices configured (parameter ) in the PLC configuration view?
-
Has an error been detected in the message logger?
This view simplifies diagnostic of detected Sercos bus errors and the diagnostic messages of the devices. The graphical display of the devices and connections helps to localize Sercos bus errors and the diagnostic messages of the devices.
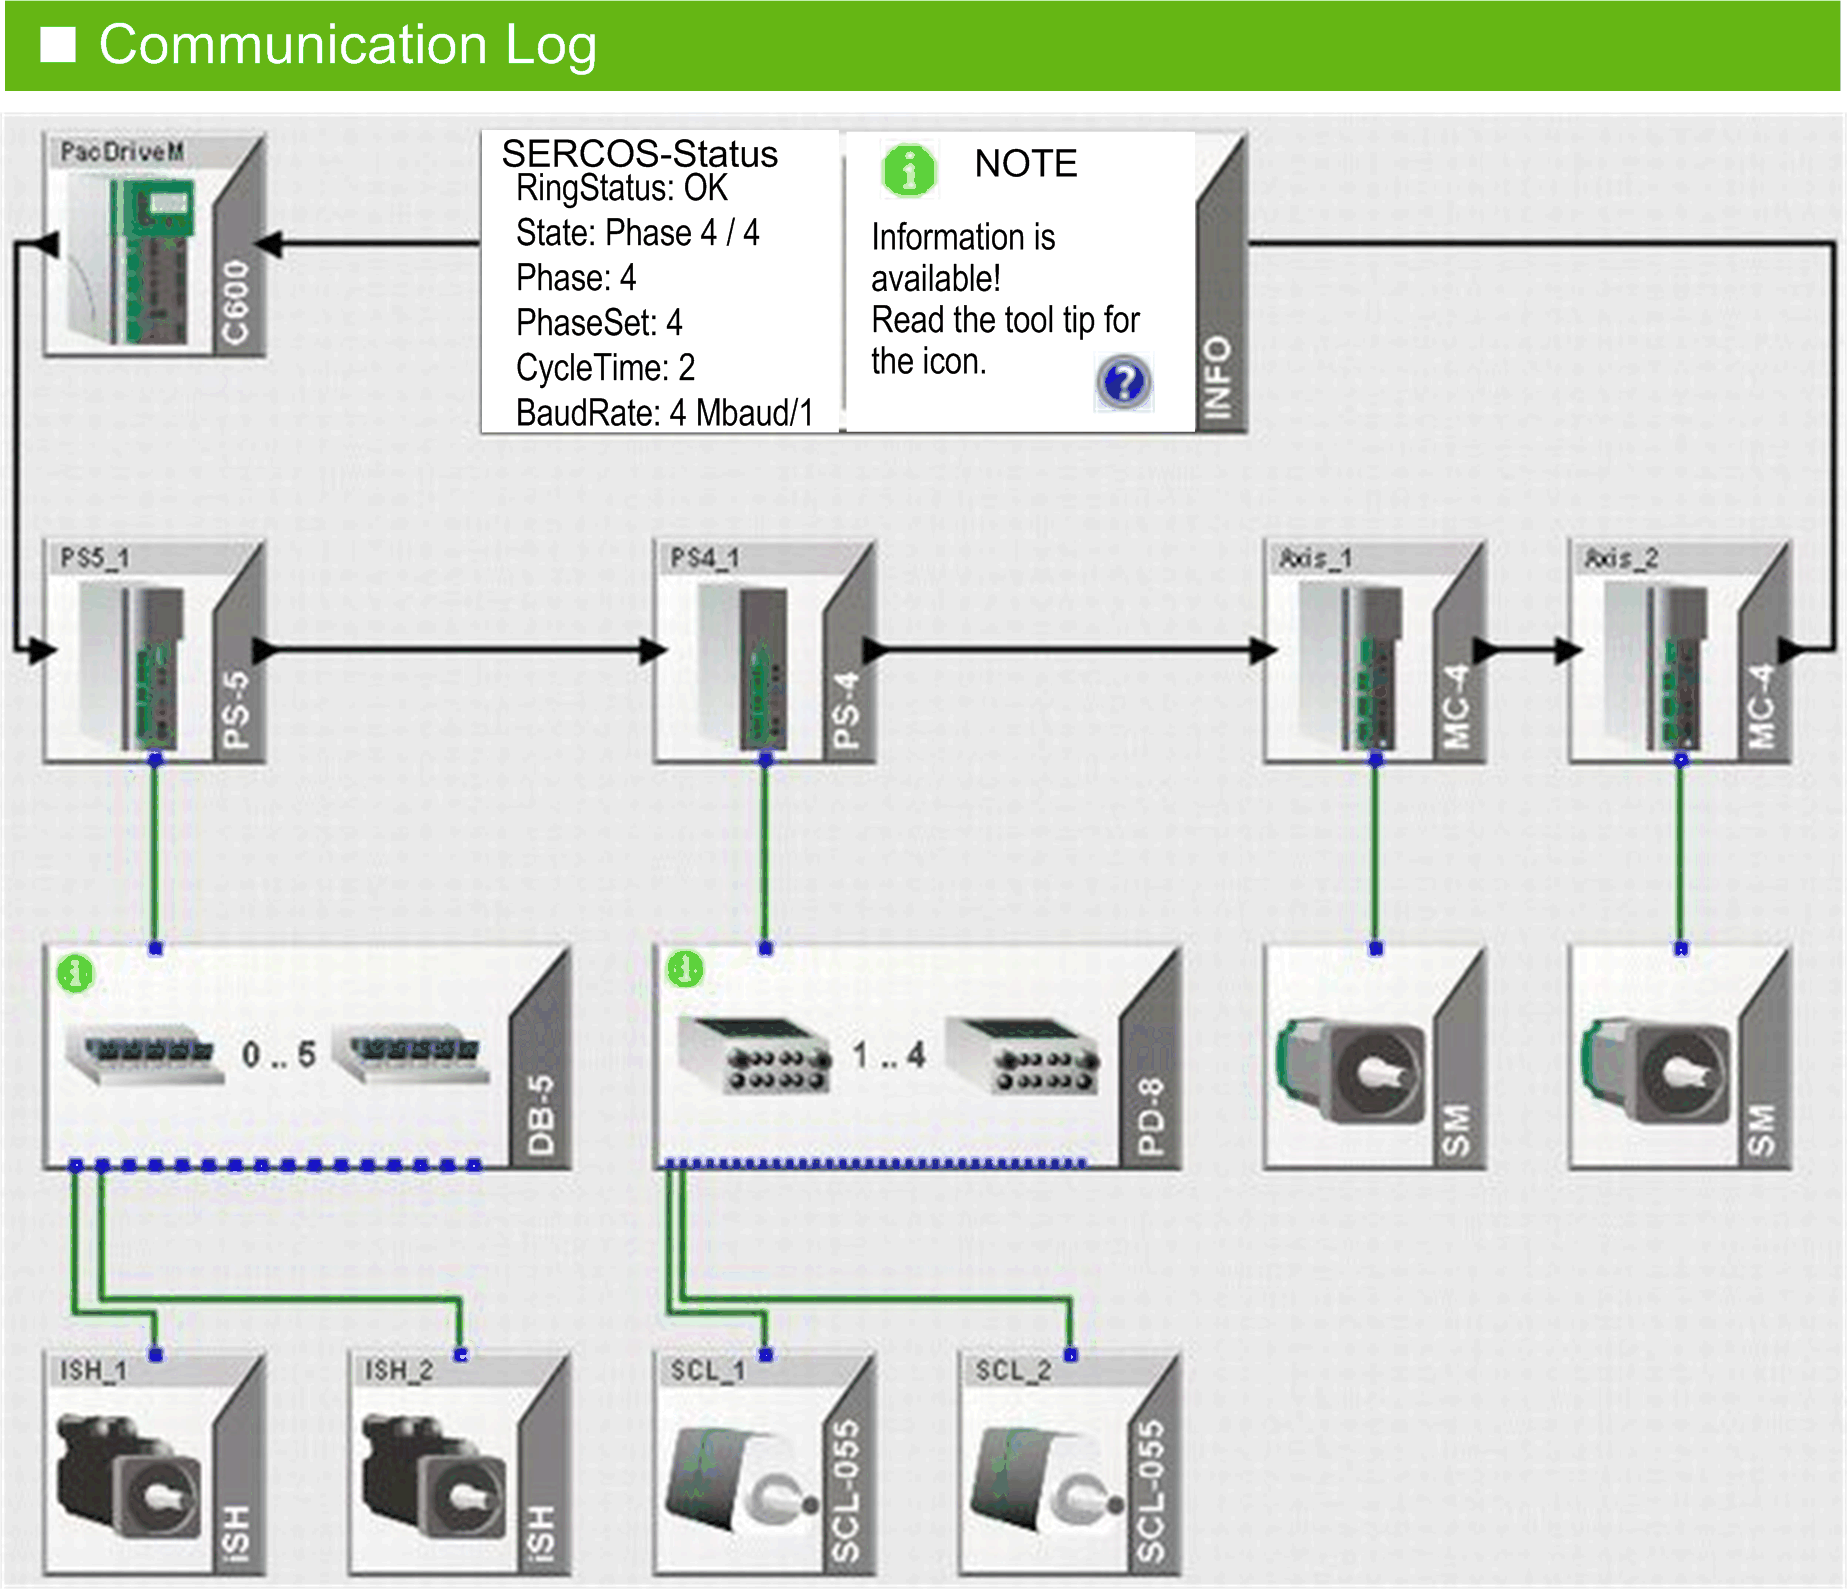
The devices are displayed according to their physical sequence in the Sercos loop. You can recognize the wiring of the system by the different cable types:
-
Green: hybrid cable
-
Black: fiberoptic conductor
The motor types connected to the servo amplifiers are also displayed differentially. systems with the distribution boxes and systems with the distribution boxes and their wiring are also displayed.
Device Display
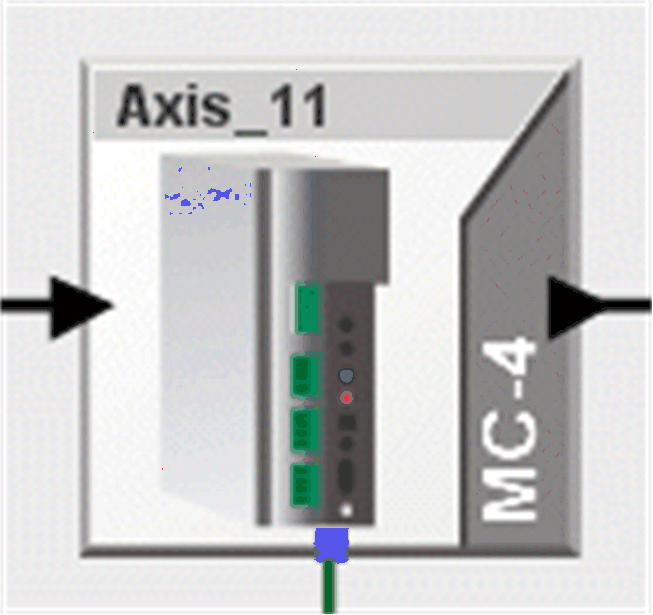
The graphic shows the display of a device in normal operation:

The graphical display shows the device type (in the example ) and the device name in the PLC configuration (here ). Using the command from the contextual menu (right-clicking the device), the device is displayed directly in the PLC configuration view. When you move the mouse over the device, additional brief information is shown in a tooltip.
If you select the device, the parameters of the selected device from the are shown. The device is highlighted in a blue frame.
The parameters are from the areas of
-
Diagnostic
-
Status
-
Device type name and
-
Version number

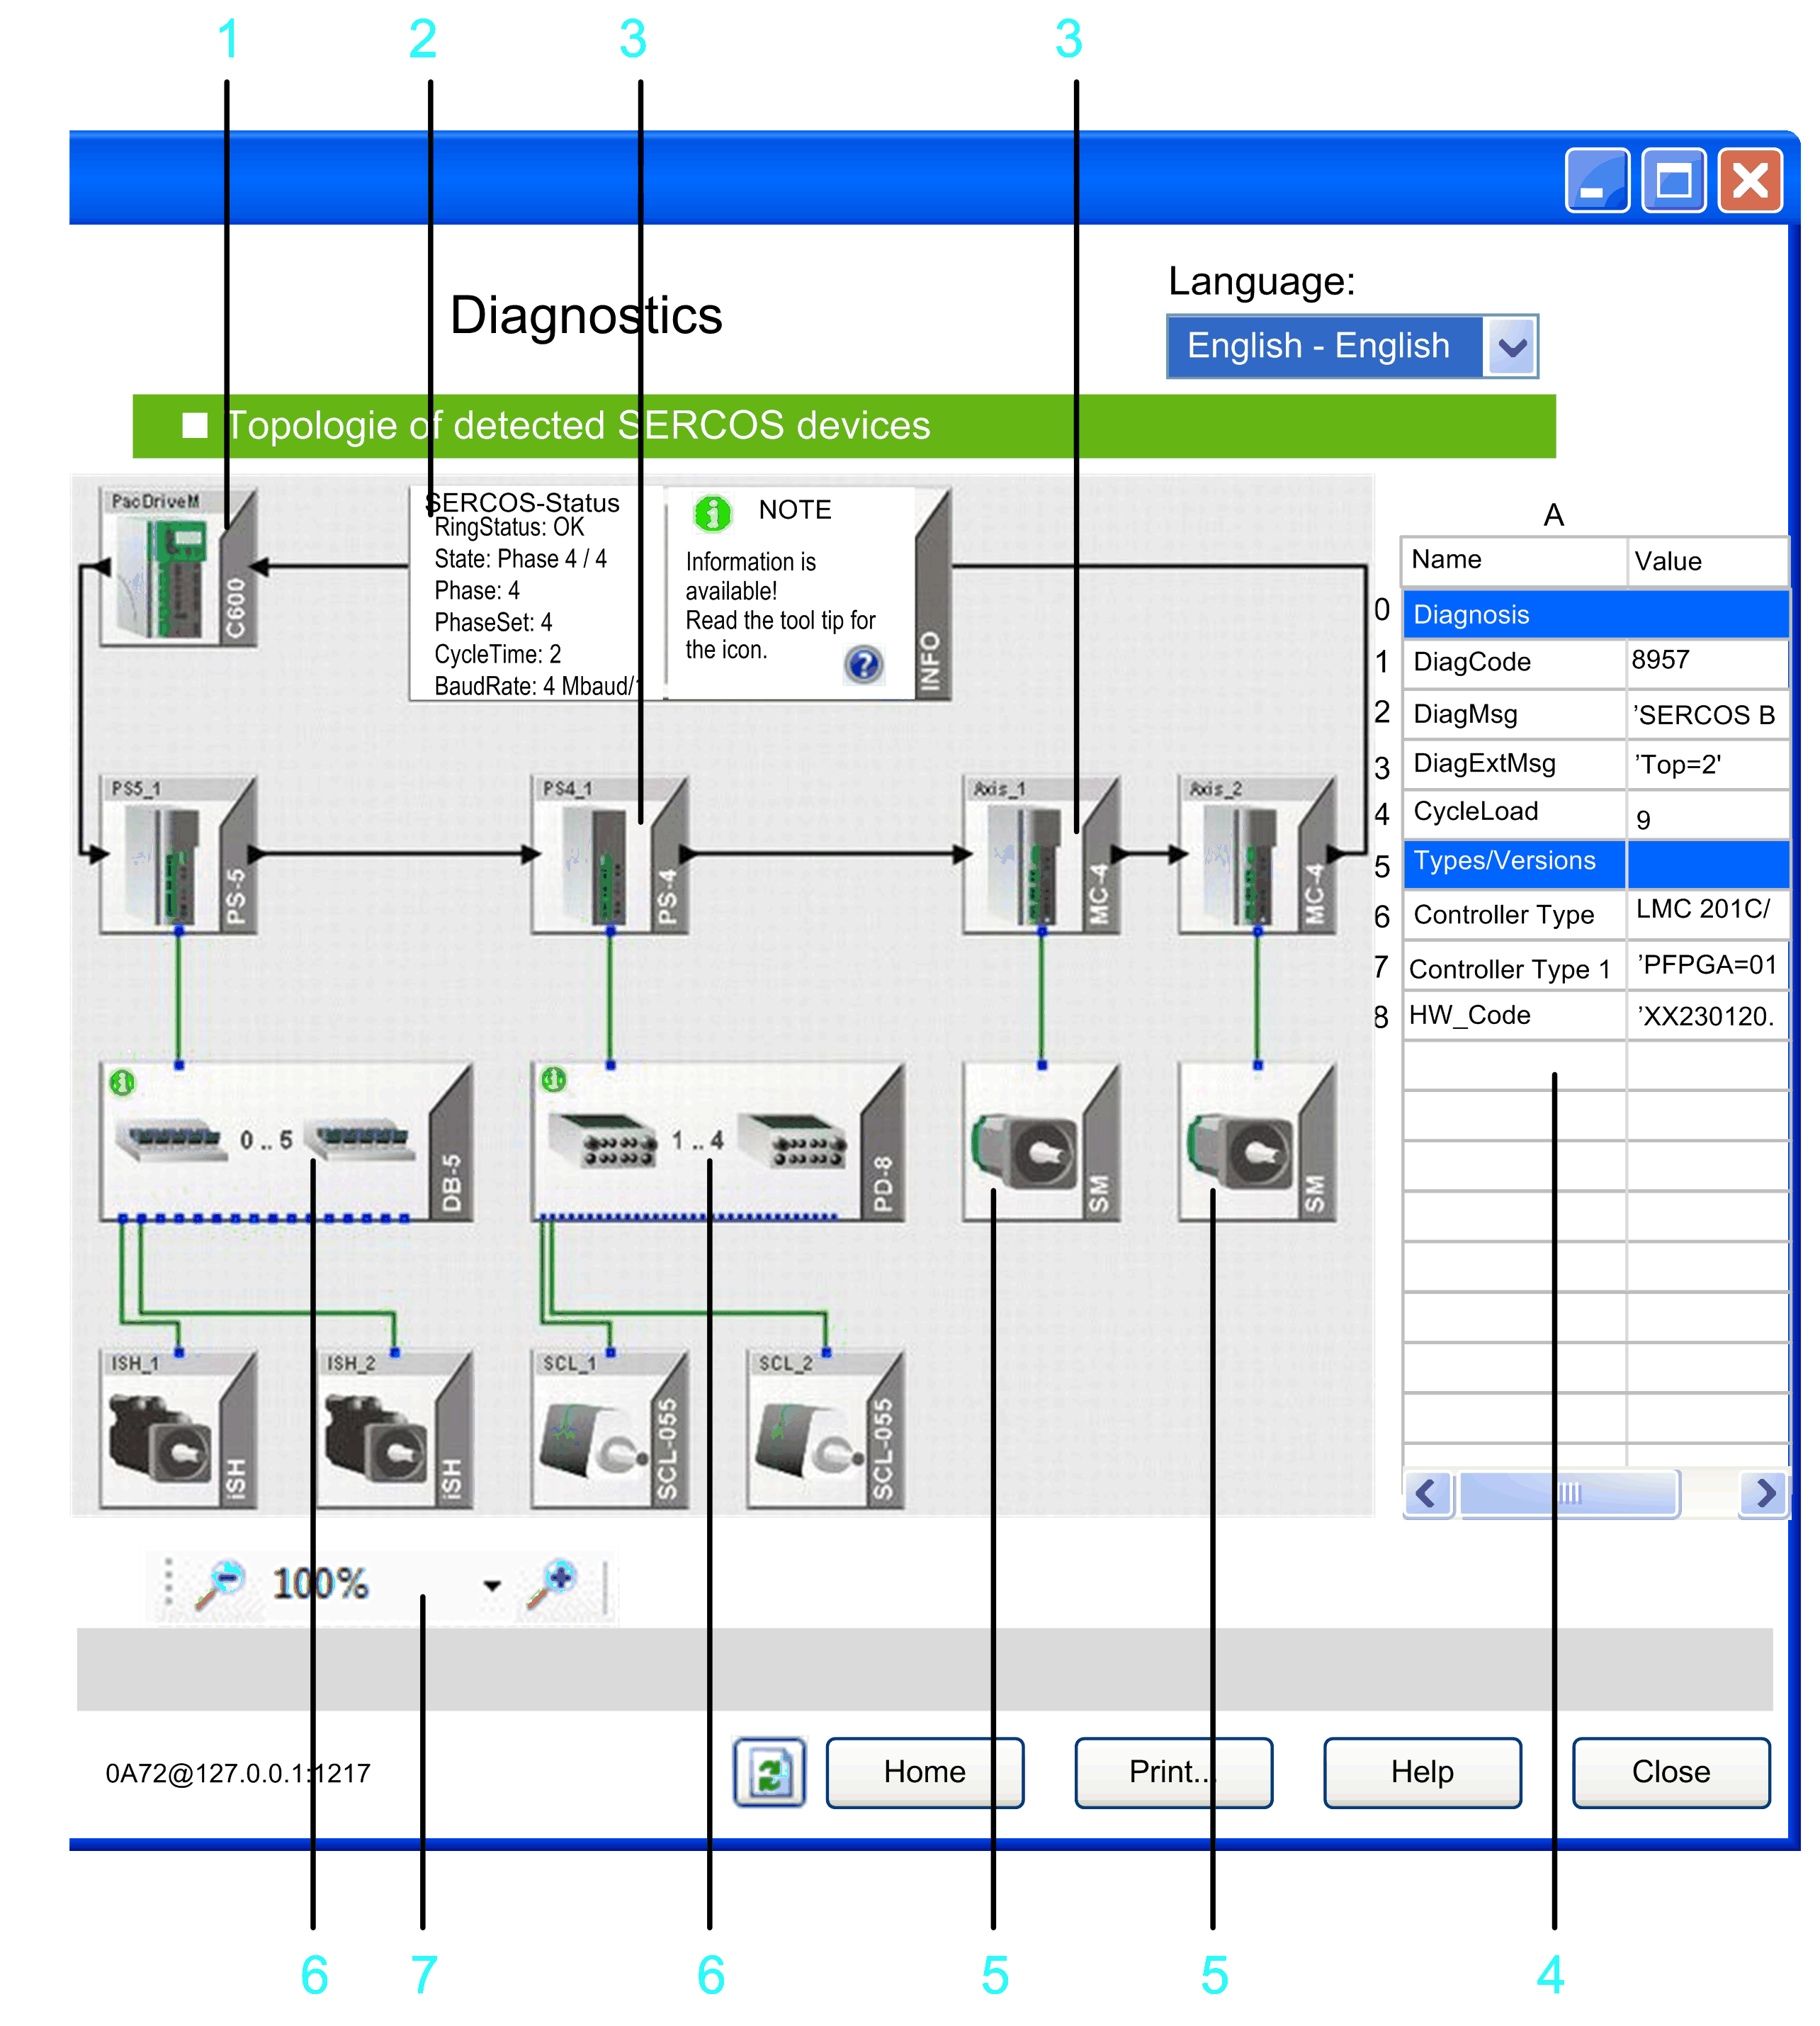
1 Controller (Sercos master)
2 General information about the Sercos bus, such as the ring status or the phase, is shown in the INFO field. You can extend the information window as required. It serves as a legend for the graphical display.
3 Sercos slave (for example, MC-4)
4 Properties of the selected device. Click a device to select it. The device is highlighted in a blue frame.
5 SM-motor connected to the MC-4.
6 Distribution clamps DB-5 and PD-8 with green info symbol i (Refer to the Info Symbol chapter.)
7 Zoom for the graphical display.
Contextual Menu
Right-click a device to open the contextual menu. It provides two commands:
-
displays the device directly in the PLC configuration view.
-
opens the Diagnostics online help.
Tooltip
When you move the mouse over the device, additional brief information is shown in a tooltip.
Customizing the Graphical Display
To shift the display, click in a free area inside the screen and move the mouse while holding the button. In doing so, a hand appears as the pointer.
You can set the magnification (zoom) of the display using the magnifying glass symbol and the selection box. You can also set the magnification with the mouse wheel. Double-clicking the mouse wheel magnifies the display over the entire topology in the window.
Sercos Bus Diagnostics
If a Sercos error is detected in the system, the affected devices are identified with a colored frame. The affected connections are also marked with a color.
-
Orange: A Sercos error has been detected.
-
Orange (with interrupted frame): Sercos errors have been detected in the last operating phase (Phase 4). Once a slave recognizes an error in the current operating state, the display changes back to orange (unbroken-line frame).
-
Red: Permanent Sercos loop interruption detected.