Getting Started with Trend Visualization
When you execute a Trend, it is best to proceed with user guidance and the help of the trend wizard.
Development of a visualization with trend
-
Create an empty standard project and program at least one variable into
PLC_PRG.⇒
PLC_PRGis declared and implemented -
Add the Visualization object to the device tree below Application.
⇒ An empty visualization appears.
-
Open .
-
Drag the Trend element to the visualization
⇒ The Trend Recording dialog opens with the Recording Settings.
-
Select the task in which the trend recording will be executed.
NoteIn general the trend recording runs in the same task as the main program, i.e. PLC_PRG.
Therefore, select
MainTask. -
Add a trend variable with Add Variable and assign an IEC variable from PLC_PRG to the trend variable.
-
Click OK to close Trend Configuration.
⇒ There is a newly created object of the type Trend recording under Trend Recording Manager. The active visualization contains a Trend element that is selected.
-
Click .
⇒ The Trend Wizard dialog box opens.
-
By default, all three control elements are activated in the dialog. Click OK to close the dialog box.
⇒ The active visualization contains a Trend with control elements.
-
Set the application containing the trend objects to active.
-
Compile the application with F11.
-
Click .
-
Start the application with F5.
⇒ The target visualization appears. The visualization contains the trend diagram with the value curve of the variable. The control elements enable user inputs.
See also
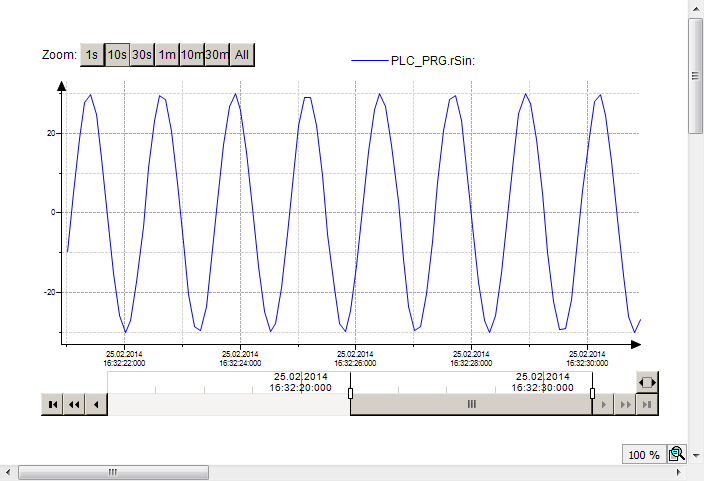
Example: Visualization of the sinusoidal trend of an IEC variable.
The following objects are implemented in the project:
-
PLC_PRG -
Visualization_Trend1 -
VisuWithTrend
PLC_PRG
PLC_PRG runs as part of the application on the controller.
PROGRAM PLC_PRG
VAR
        iVar : INT;
        rSin : REAL;
        rVar : REAL;
END_VAR

iVar := iVar + 1;
iVar := iVar MOD 33;

rVar := rVar + 0.1;
rSin := 30 * SIN(rVar);
Visualization_Trend1
Visualization_Trend1 is the object that contains the configuration of the trend recording.
VisuWithTrend
VisuWithTrend is the object that visualizes the trend.
The visualization contains four elements: one Trend and three control elements. The properties of the trend are defined as follows.
|
Properties |
Value |
|---|---|
|
Trend recording |
Visualization_Trend1 |
|
Display cursor |
|
|
Display tool tip |
|
|
Show frame |
|
|
Date Range Picker |
|
|
Time Picker |
|
|
Legend |
|
VisuWithTrend at runtime