Diagnostics: Web Server
Overview
The Web server of the controller has a diagnostic tab.
In this tab, you can access to Industrial Ethernet diagnostic pages:
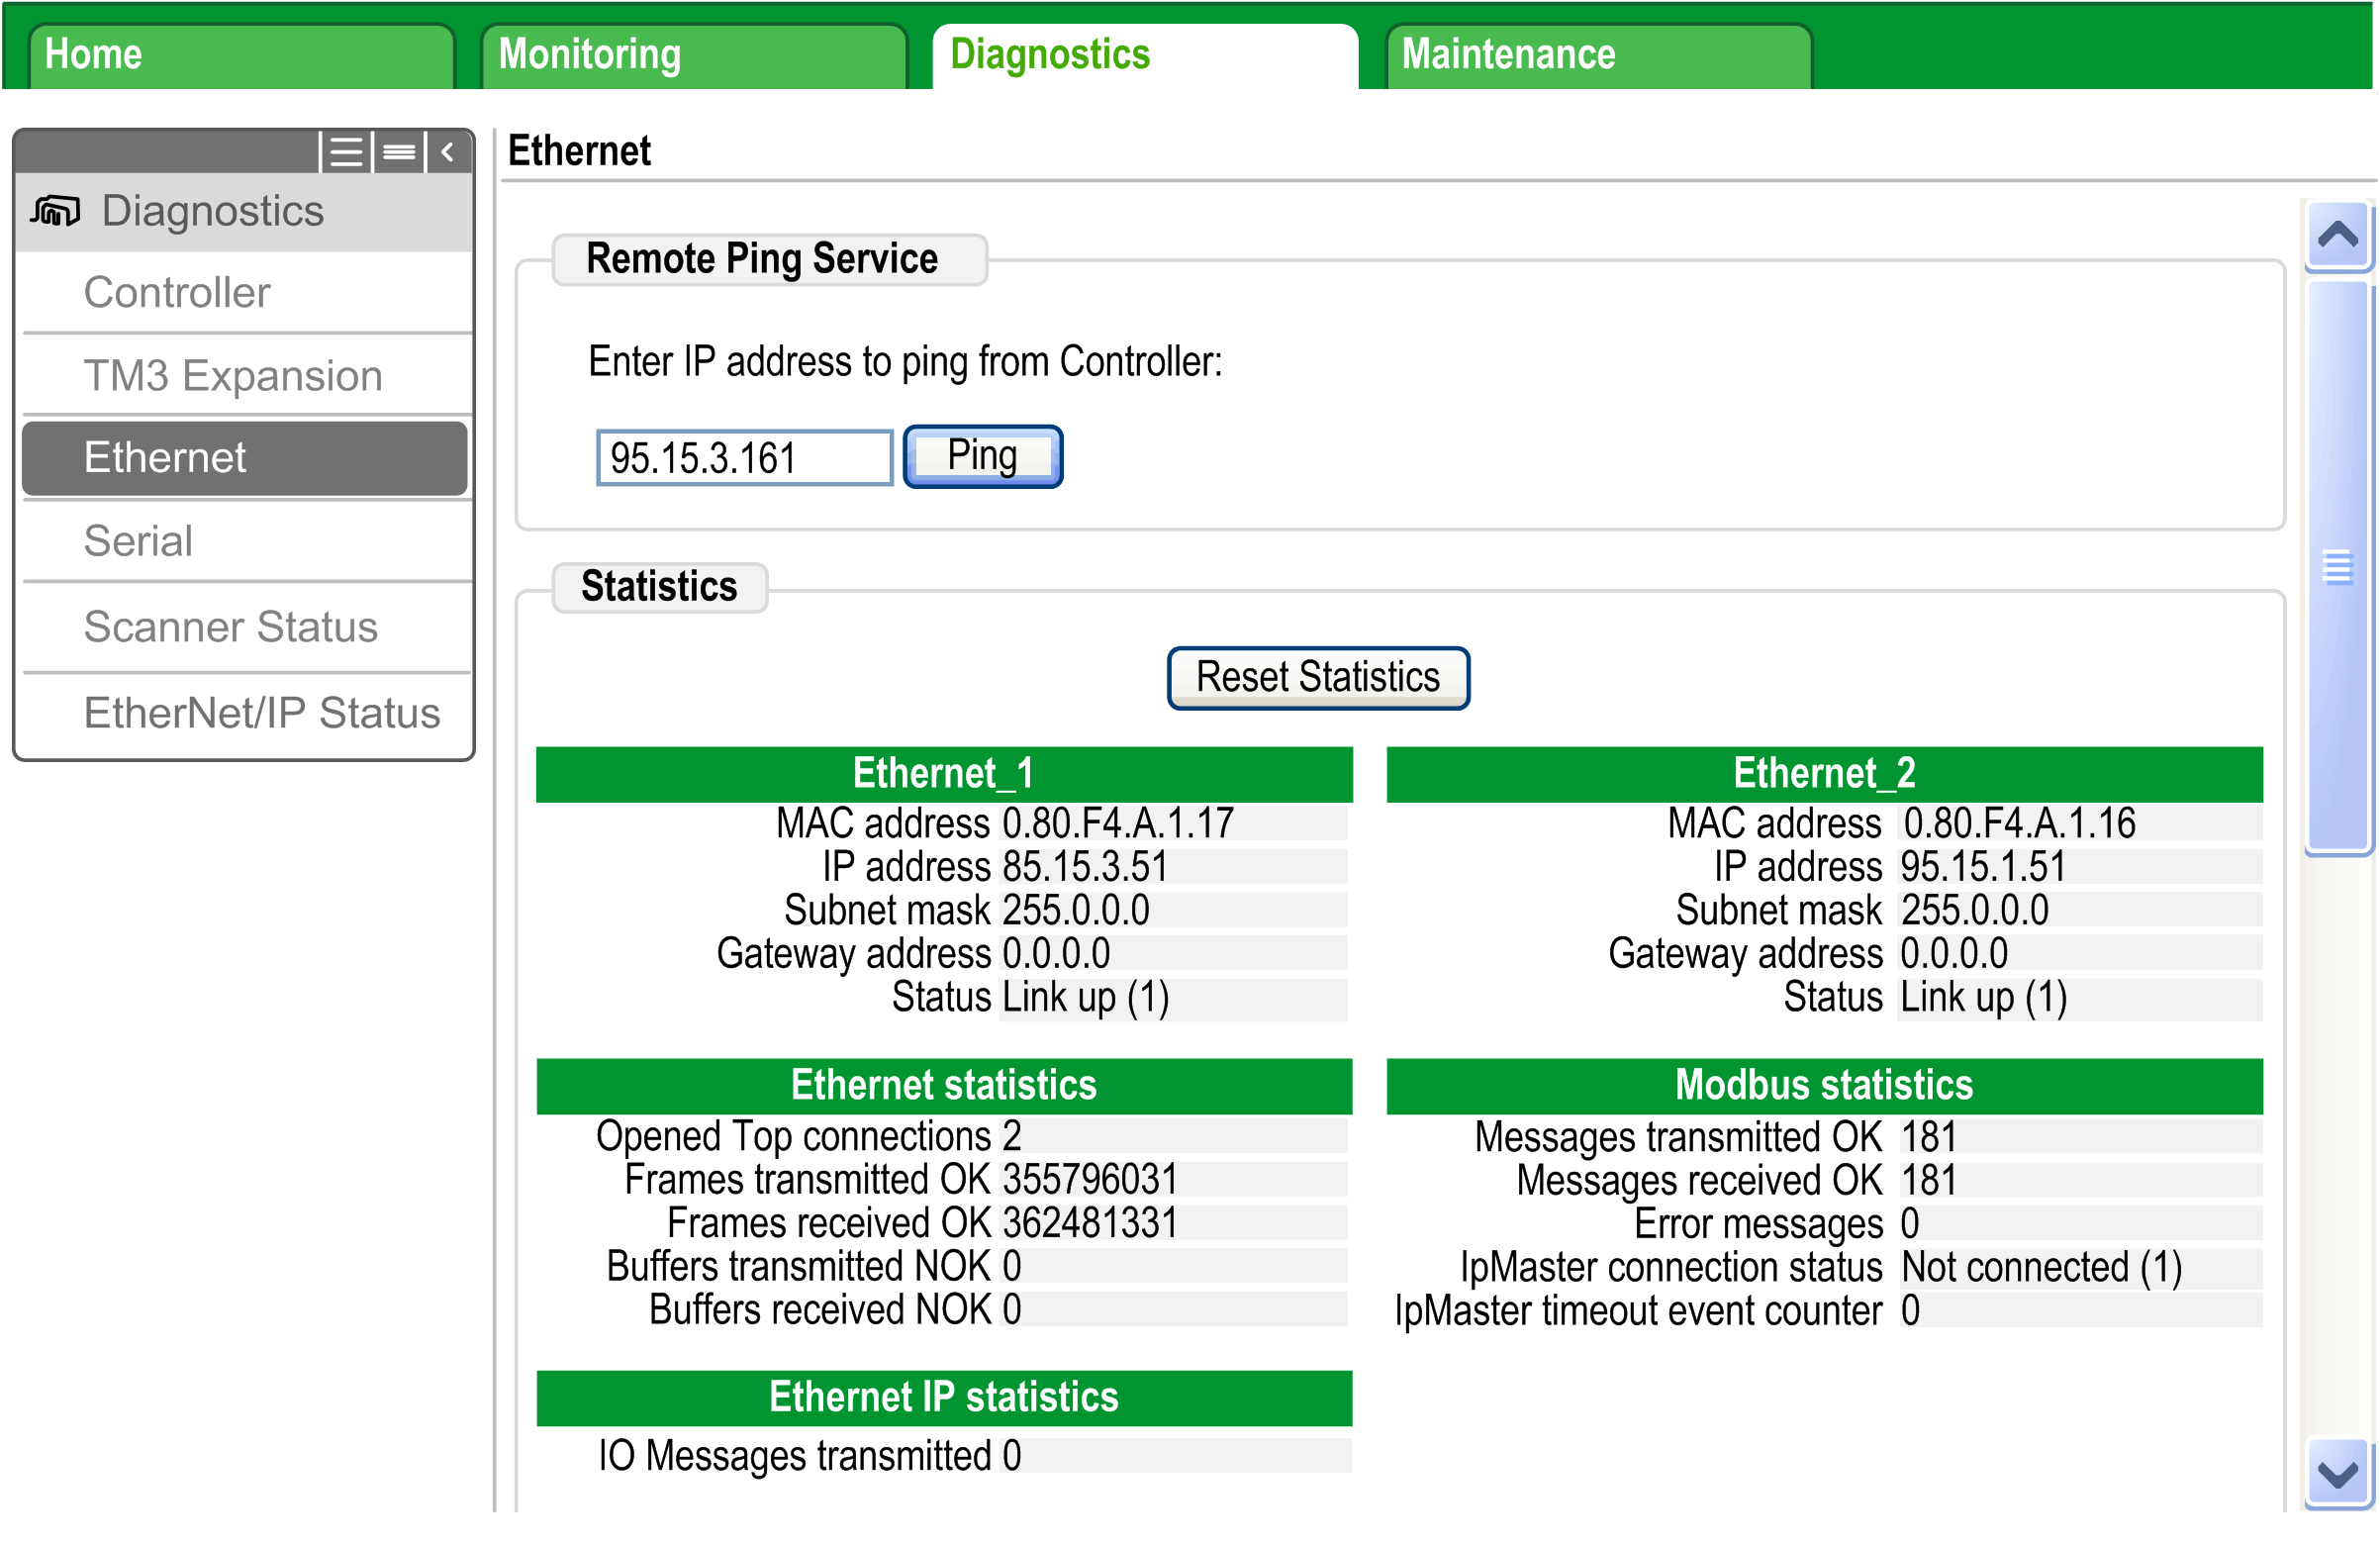
Ethernet Page
Click to display Ethernet information of the controller and to allow you to test communication with a specific IP address:

This table presents the ping test result on the page:
|
Icon |
Meaning |
|---|---|

|
The communication test is successful. |

|
The controller is unable to communicate with the defined IP address. |
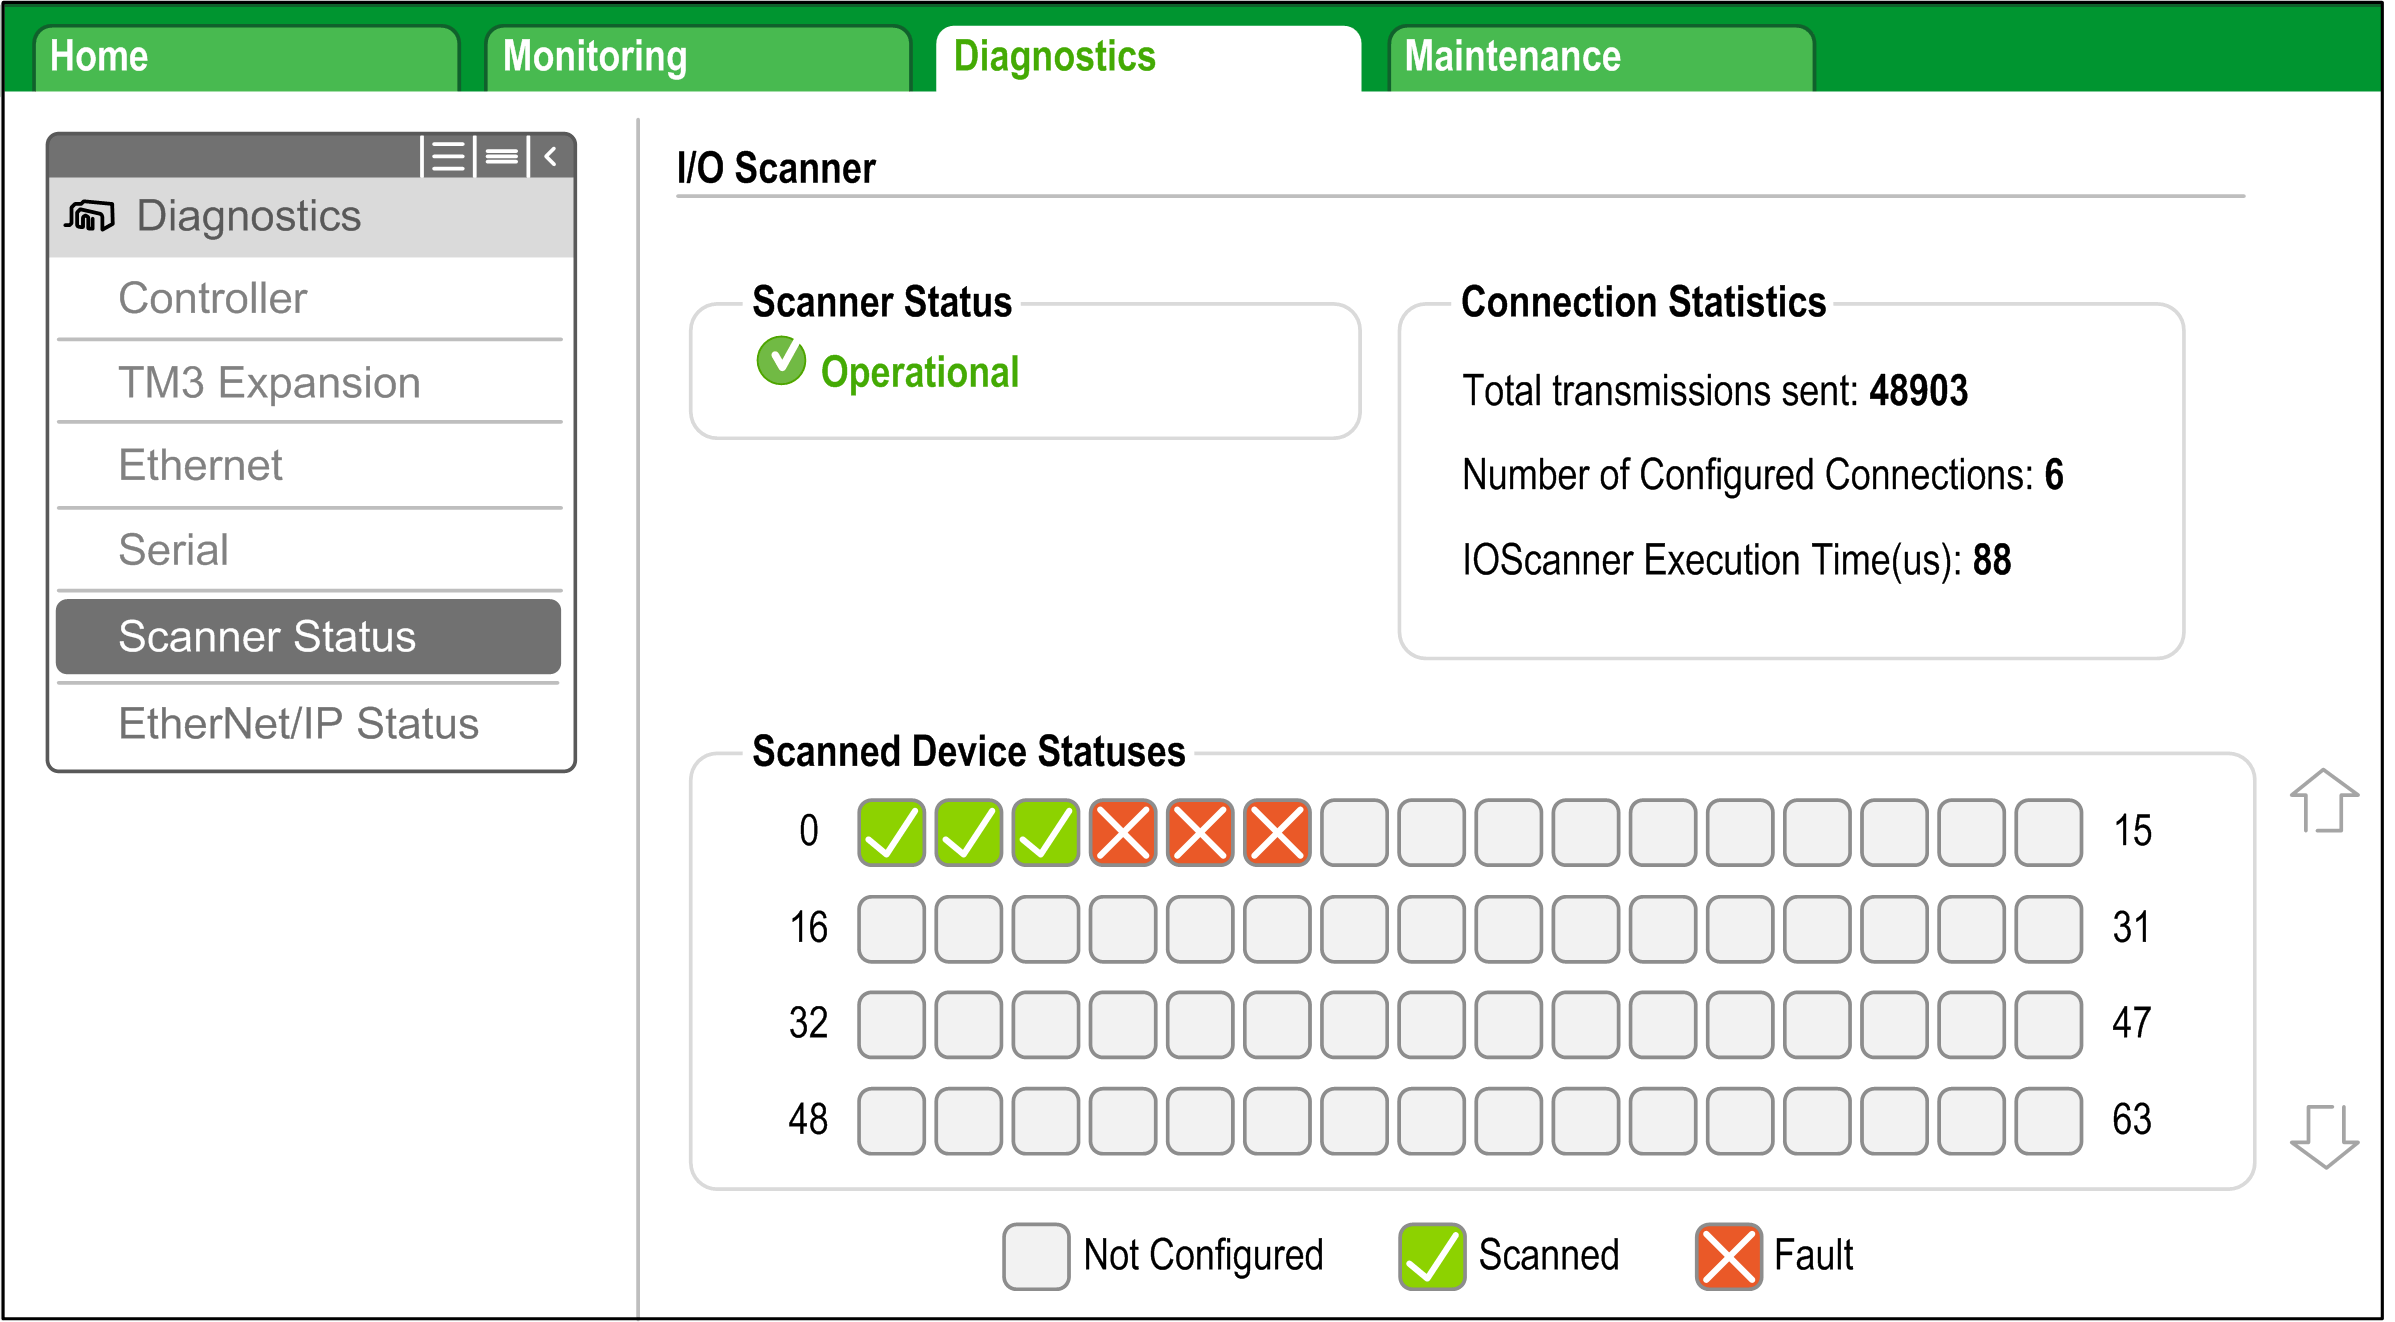
Modbus TCP Status Page
Click to display the Modbus TCP IOScanner status (IDLE, STOPPED, OPERATIONAL) and the health bit of up to 64 Modbus TCP slave devices:

corresponds to the channel ID.
This table presents the status of each channel presented on the page:
|
Icon |
Health bit value |
Meaning |
Scanner status |
|---|---|---|---|
|
|
1 |
Request and reply are ongoing on time. |
OPERATIONAL |
|
|
0 |
An error is detected, the communications are closed. |
OPERATIONAL |
|
|
– |
This ID does not correspond to a configured channel. |
OPERATIONAL |
|
|
0 |
The communications are closed. |
STOPPED |
If the Modbus TCP IOScanner status is IDLE, no icon is displayed; No scanned device reported is displayed.


