Getting Started with Trend Visualization
When you execute a trend, it is best to proceed with user guidance and the help of the trend wizard.
Development of a visualization with trend
-
Create an empty standard project and program at least one variable into
PLC_PRG.-
PLC_PRGis declared and implemented
-
-
Start the application with F5.
-
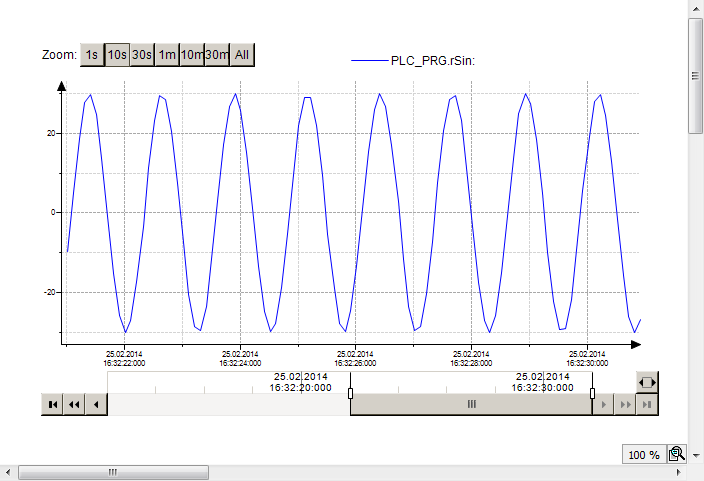
The target visualization appears. The visualization contains the trend diagram with the value curve of the variable. The controls enable user inputs.
-
Visualization of the sinusoidal trend of an IEC variable
The following objects are implemented in the project:
-
PLC_PRG -
Visualization_Trend1 -
VisuWithTrend
The PLC_PRG program runs as part of the application on the controller.
PROGRAM PLC_PRG
VAR
    iVar : INT;
    rSin : REAL;
    rVar : REAL;
END_VAR
iVar := iVar + 1;
iVar := iVar MOD 33;
rVar := rVar + 0.1;
rSin := 30 * SIN(rVar);
Visualization_Trend1
Visualization_Trend1 is the object that contains the configuration of the trend recording.
VisuWithTrend
VisuWithTrend is the object that displays the trend.
The visualization contains four elements: one Trend and three controls. The properties of the trend are defined as follows.
|
Properties |
Value |
|---|---|
|
Trend recording |
Visualization_Trend1 |
|
Show cursor |

|
|
Show tooltip |
|
|
Show frame |
|
|
Date Range Picker |
|
|
Time Picker |
|
|
Legend |
|
 : Trend1DateRangeSelector
 : Trend1TimeSelector
 : Trend1Legend
VisuWithTrend at runtime