Viewing waveforms on meter webpages
Use the waveform viewer on your meter’s webpages to view the meter’s COMTRADE waveform files.
Prerequisites:
Ensure the meter is configured to record waveforms by setting the nominal voltage.
To view waveforms on meter webpages:
- Open a browser and go to the IP address for your meter, entering valid login credentials when requested.
- Navigate to .
A screen displays with accordion menus for three COMTRADE modules (regardless of whether or not that COMTRADE module is being created by the meter). The waveform viewer for COMTRADE_1 is expanded.
By default, COMTRADE_1 displays the sag/swell waveform records. COMTRADE_2 and COMTRADE_3 are used if you have configured additional waveform recorders and connected them to COMTRADE modules.
- Select the accordion menu for the COMTRADE records you
want to view, for example COMTRADE_2.
The waveform viewer for those COMTRADE records is displayed.
- Select the file you want to view from the record drop-down
list box.
The numbering starts at 0 (zero), which means you select cmt0_00004 to view the fifth file for COMTRADE_1.
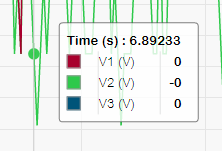
- Click or tap an individual voltage or current channel in the legend to show or hide it in the waveform viewer.
-
 Visible
 -
 Hidden
 - Use the bar at the bottom to zoom in/zoom out on a particular
section of the waveform, or to scan through the waveform with the
selected zoom level.
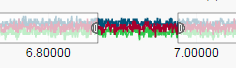
- Draw a window over a particular area to zoom in on that section of the waveform.
- Drag the selected area to move the zoom across the waveform.
- Drag the start and end points to expand or narrow the zoom.
- Hover over or tap a spot on the waveform to view the values
associated with that particular moment in time.