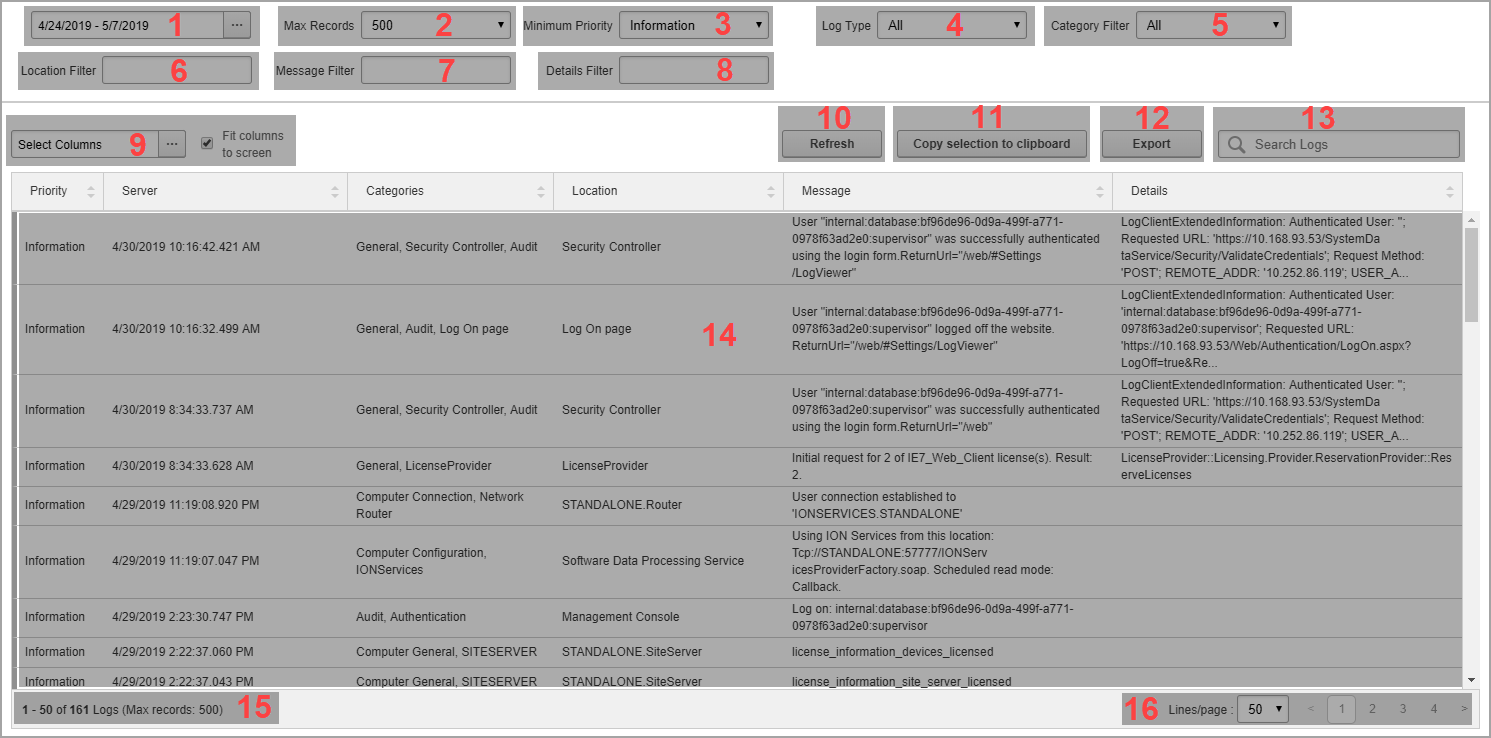
Log Viewer
TIP: You can open Log Viewer from the SETTINGS > System > System Log page in Web Applications.
Use Log Viewer to view PME system events. System events are logged by the software and its components to record certain system activities. Examples of system events include a user logging on, a user logging off, time synchronization sent from the system to the devices, system warnings, and so on.
NOTE: The Log Viewer only shows system events, it does not show device based events or historical data. To view device event log data, use Alarm Views. To view device historical data, use Dashboards, Diagrams, or Reports.
Log Viewer User Interface

| 1 |
Date Range Selector.
|
| 2 |
Max Records.
|
| 3 |
Minimum Priority.
|
| 4 | Log Type.
Filter log entries in the system log table view based on the area of the software where they originated. |
| 5 | Category Filter.
Filter log entries in the system log table view based on the component or function they relate to. TIP: Selecting the Audit category shows user login and logoff activity. |
| 6 | Location Filter.
Enter a filter string into the text box to filter the system log table view based on the Location column information. |
| 7 | Message Filter.
Enter a filter string into the text box to filter the system log table view based on the Message column information. |
| 8 | Details Filter.
Enter a filter string into the text box to filter the system log table view based on the Details column information. |
| 9 | Column Selector.
Select which columns are displayed in the system log table. |
| 10 |
Refresh.
|
| 11 |
Copy Selection to Clipboard.
TIP: Use |
| 12 | Export
Export the content of selected system log table entries in TIP: Use |
| 13 |
Search Logs Enter a filter string into the text box to filter the system log table view based on the Details column information. |
| 14 |
System log table
TIP: Double-click a row in the table or select a row and hit |
| 15 |
Number of displayed items
|
| 16 | Page selector.
Use the page selector to navigate between pages. Set the number of items that are displayed on a page. |