Alarms UI
1 Main UI
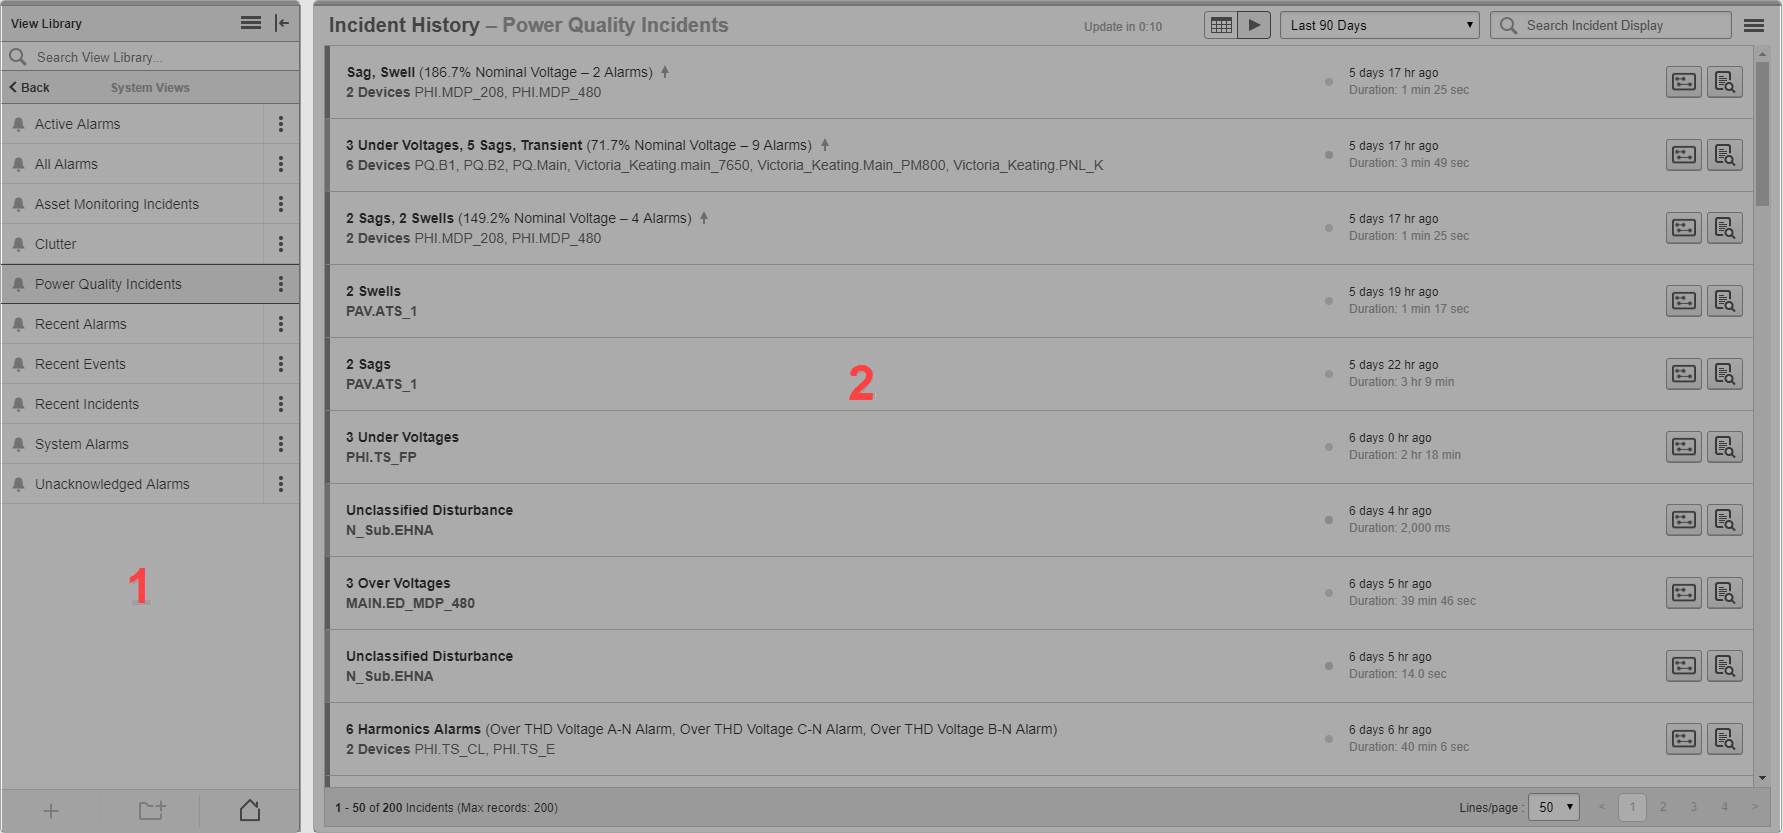
| 1 | View Library
The view library contains all the alarm views that are configured in the system. Alarm views can be listed individually, or they can be organized within folders. TIP: To hide the library, click the Hide Library icon ( |
| 2 | Alarms Display
The alarms display pane shows the alarm view selected in the view library. |
2 Alarms display UI
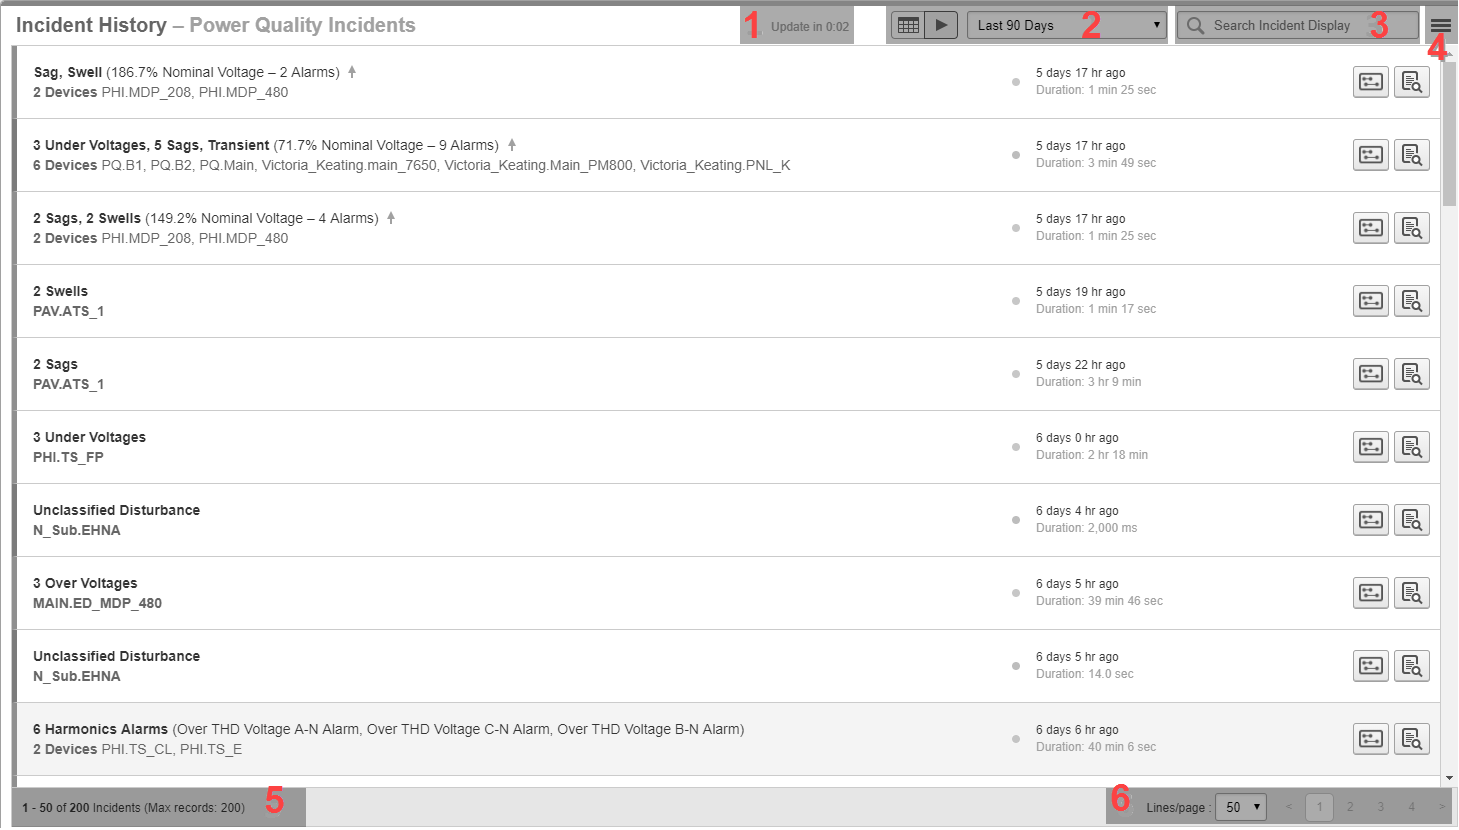
| 1 | Update timer
The update timer shows the time until the next display refresh. |
| 2 |
Update mode
NOTE: This element is only available for history views, not for status views. |
| 3 | Search filter
Enter text into the search filter to search and filter the items displayed in the alarms display pane. |
| 4 | Options menu
The Options menu contains options relevant to the content displayed in the alarms display pane. |
| 5 | Number of displayed items
Shows the number of items visible on this page, and the total number in this view. |
| 6 | Page selector
Use the page selector to navigate between pages. Set the number of items that are displayed on a page. |
3 Alarm status UI
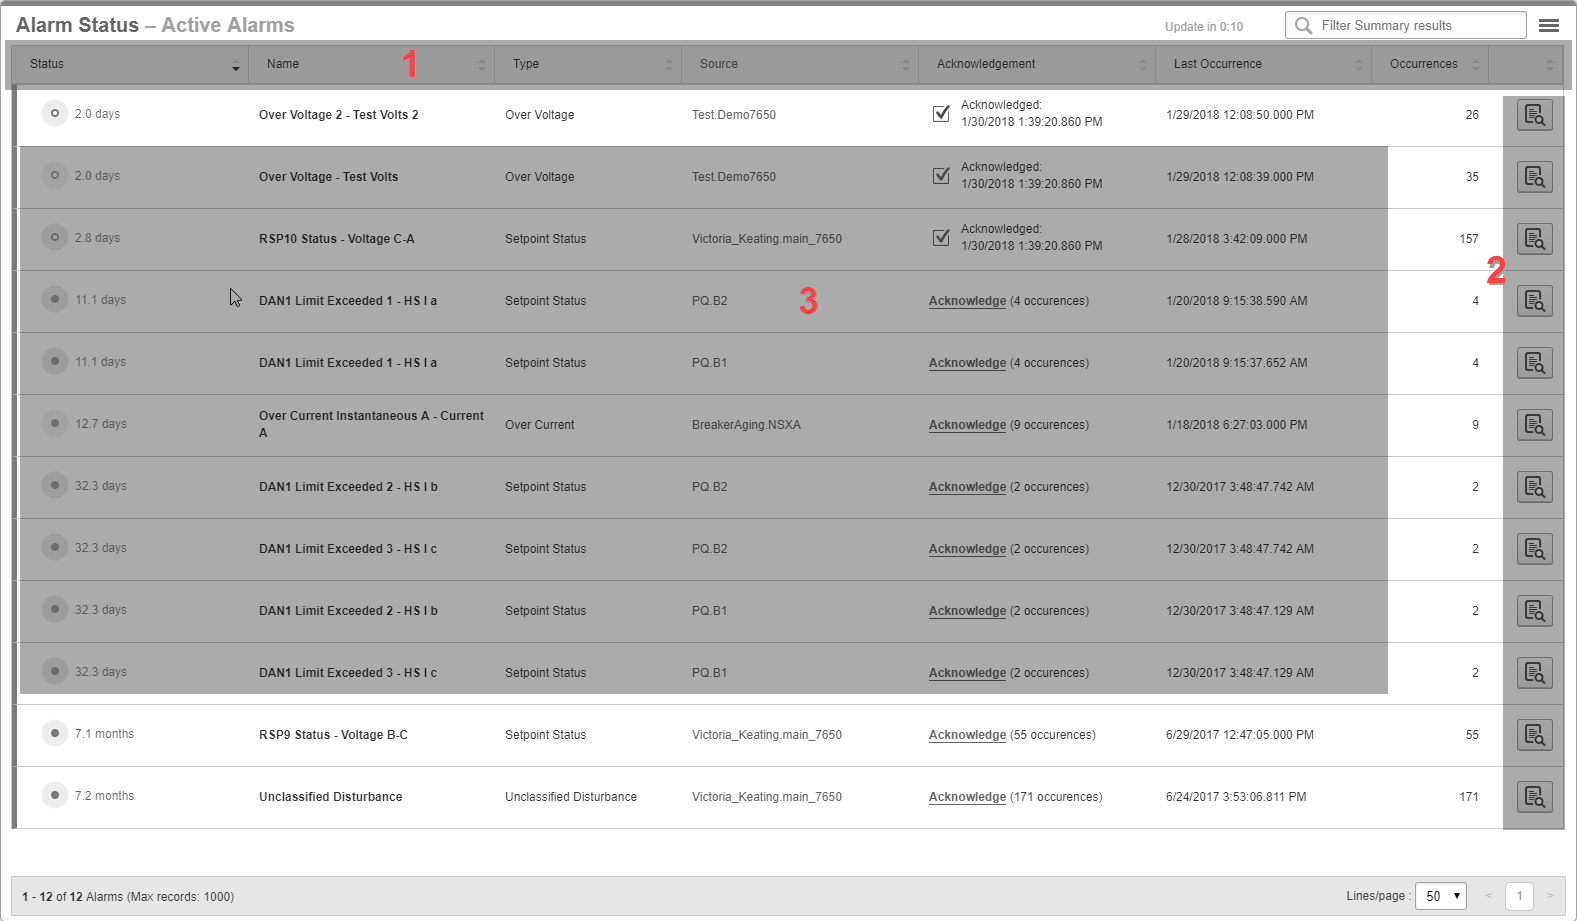
| 1 |
Alarm status table columns
|
||||||||||||||||||||||||||
| 2 | Details button
Click Details to see more information related to an alarm. (See below for more information.) |
||||||||||||||||||||||||||
| 3 | Alarm status table rows
Each row in the table shows an alarm definition that exists in the system. The filter settings in the view library control which alarm definitions are included in a view. |
3-1 Alarm definition details
TIP: Click Details for an alarm definition or double-click an alarm definition row in the table to open the alarm details.
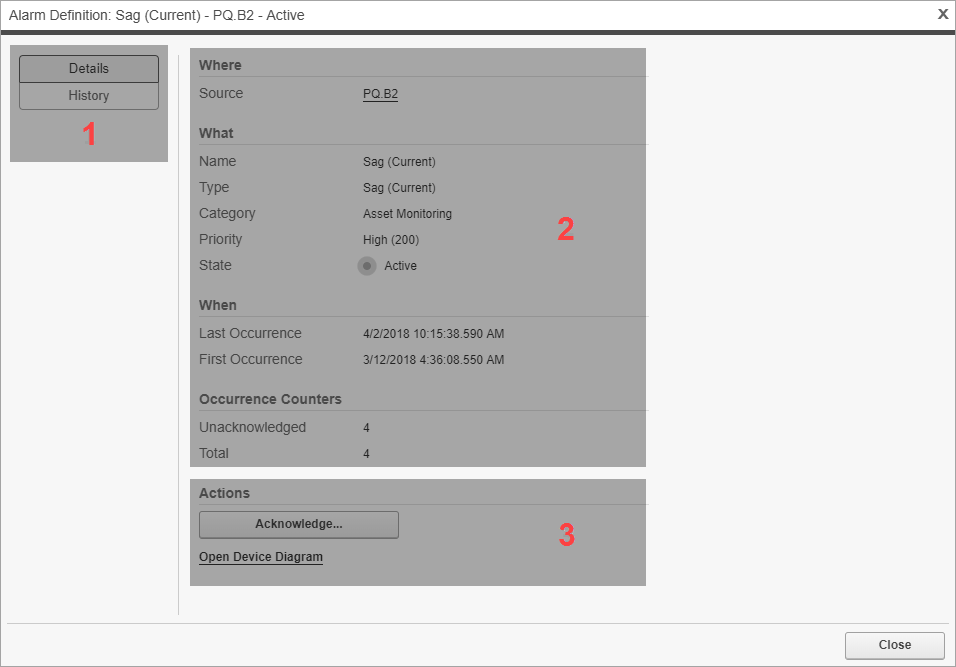
| 1 |
Display selector
|
| 2 | Alarm Definition Details information
See detailed information about this alarm definition. |
| 3 |
Actions
|
4 Alarm history UI
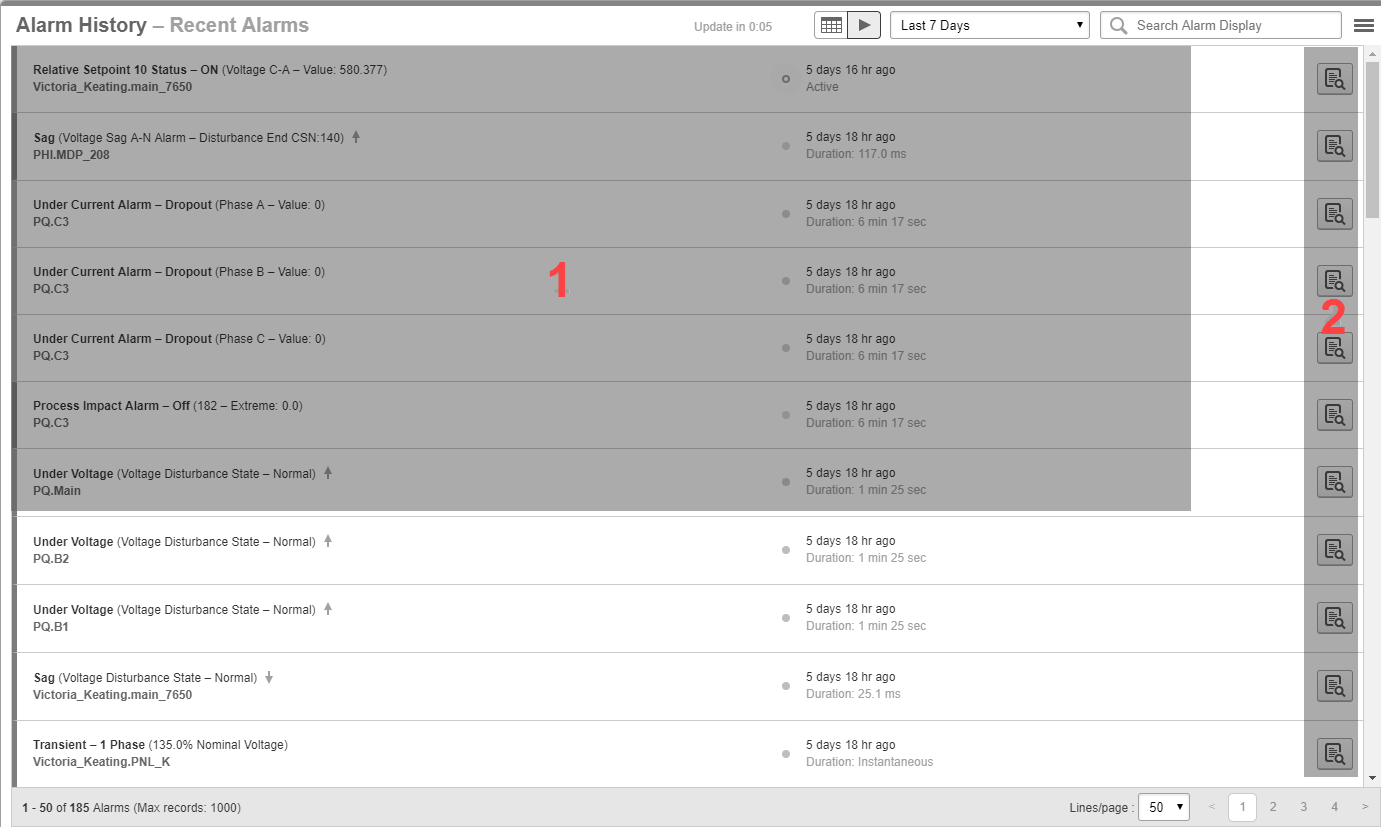
| 1 | Alarm history table rows
Each row in the table shows an alarm instance that occurred. The filter settings in the view library control which instances are included in a view. |
| 2 | Details button
Click Details |
4-1 Alarm instance details
TIP: Click Details for an alarm instance or double-click an alarm instance row in the table to open the alarm details.

| 1 |
Display selector
|
| 2 | Alarm instance details information
See detailed information about this alarm instance. |
| 3 |
Actions
|
5 Incident history UI
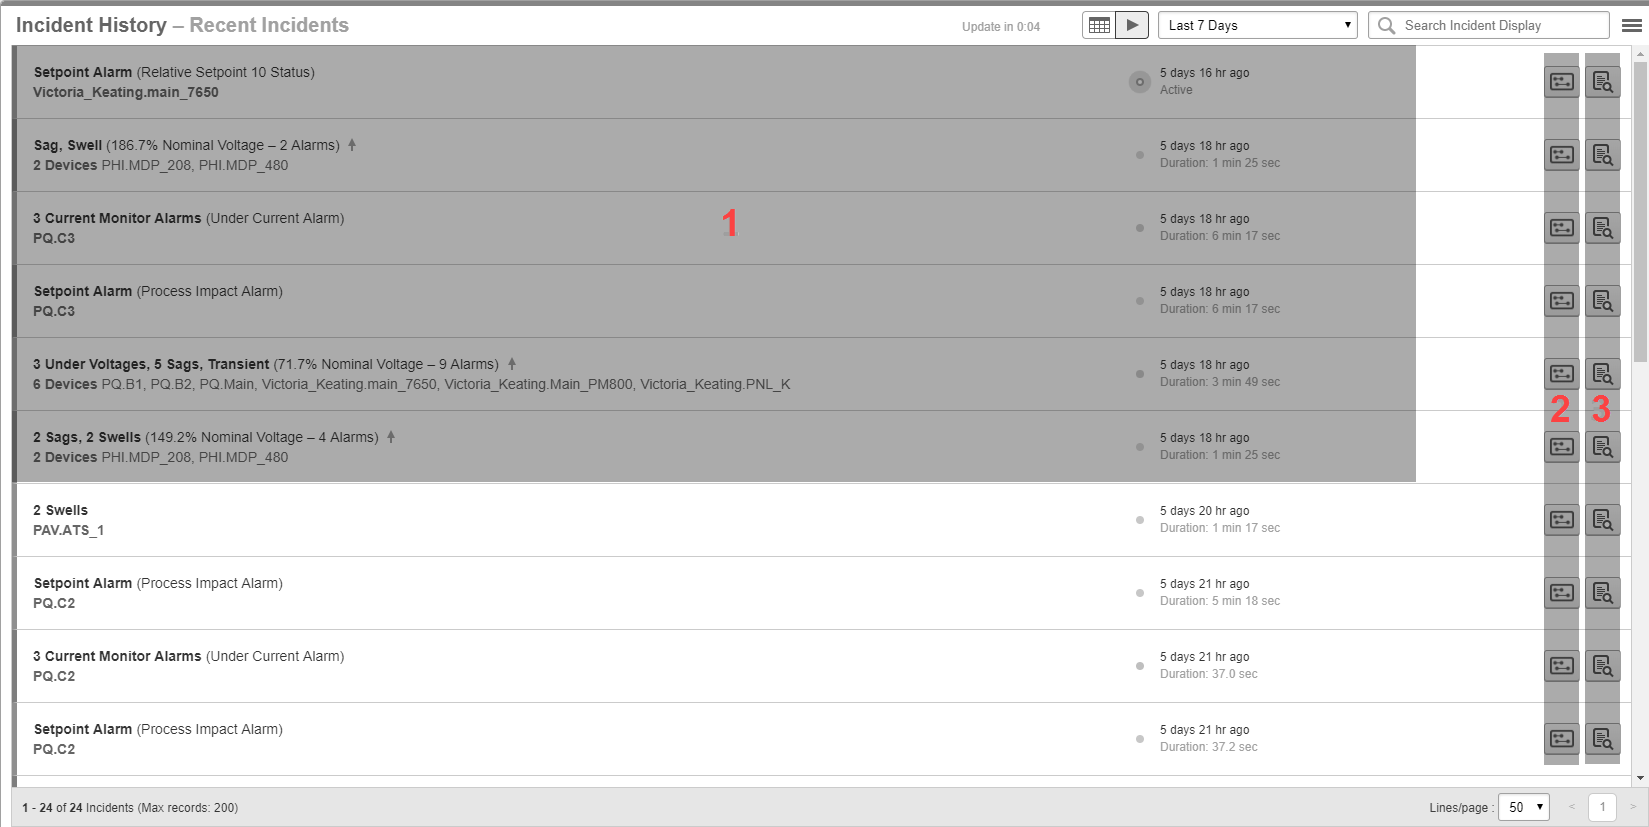
| 1 | Incident history table rows
Each row in the table shows an incident that occurred. The filter settings in the view library control which incidents are included in a view. |
| 2 |
Analysis button
TIP: To analyze multiple Incidents together, select the Incidents in the table and then choose Open Timeline Analysis on selection from the Options menu in the top right corner of the alarms display pane. TIP: For multi-selection, use |
| 3 |
Details button
|
5-1 Incident details
TIP: Click Details for an incident or double-click an incident row in the table to open the incident details.
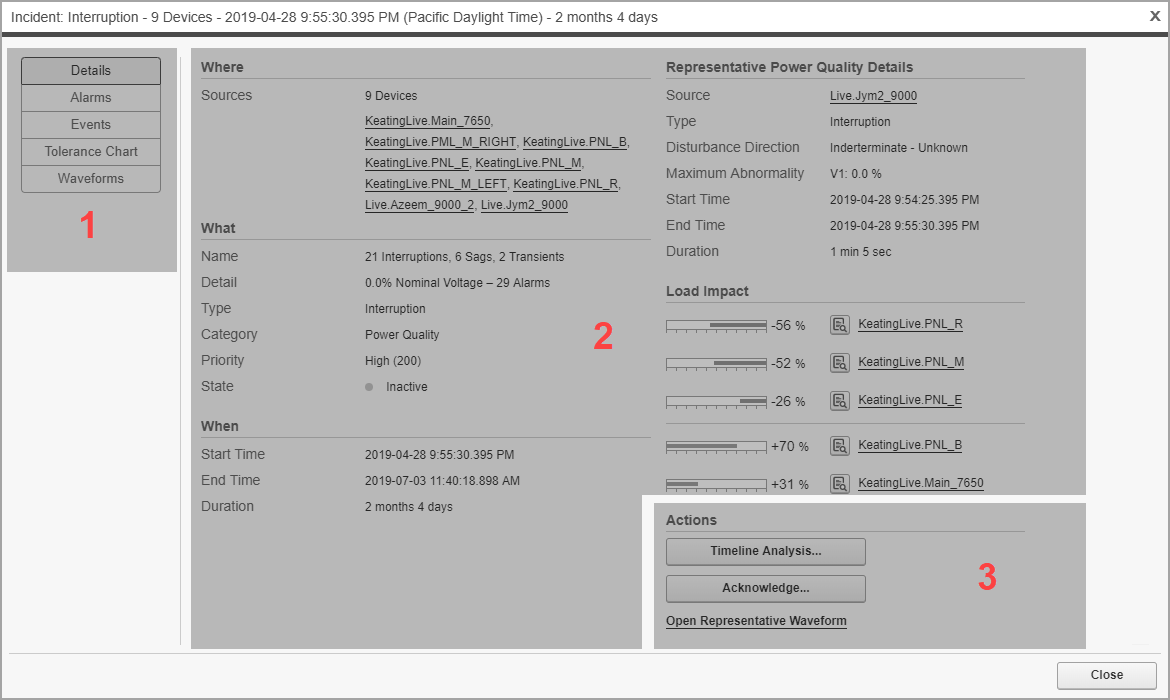
| 1 |
Display selector
|
| 2 | Incident Details information
See detailed information about this incident. |
| 3 |
Actions
|
6 Event history UI
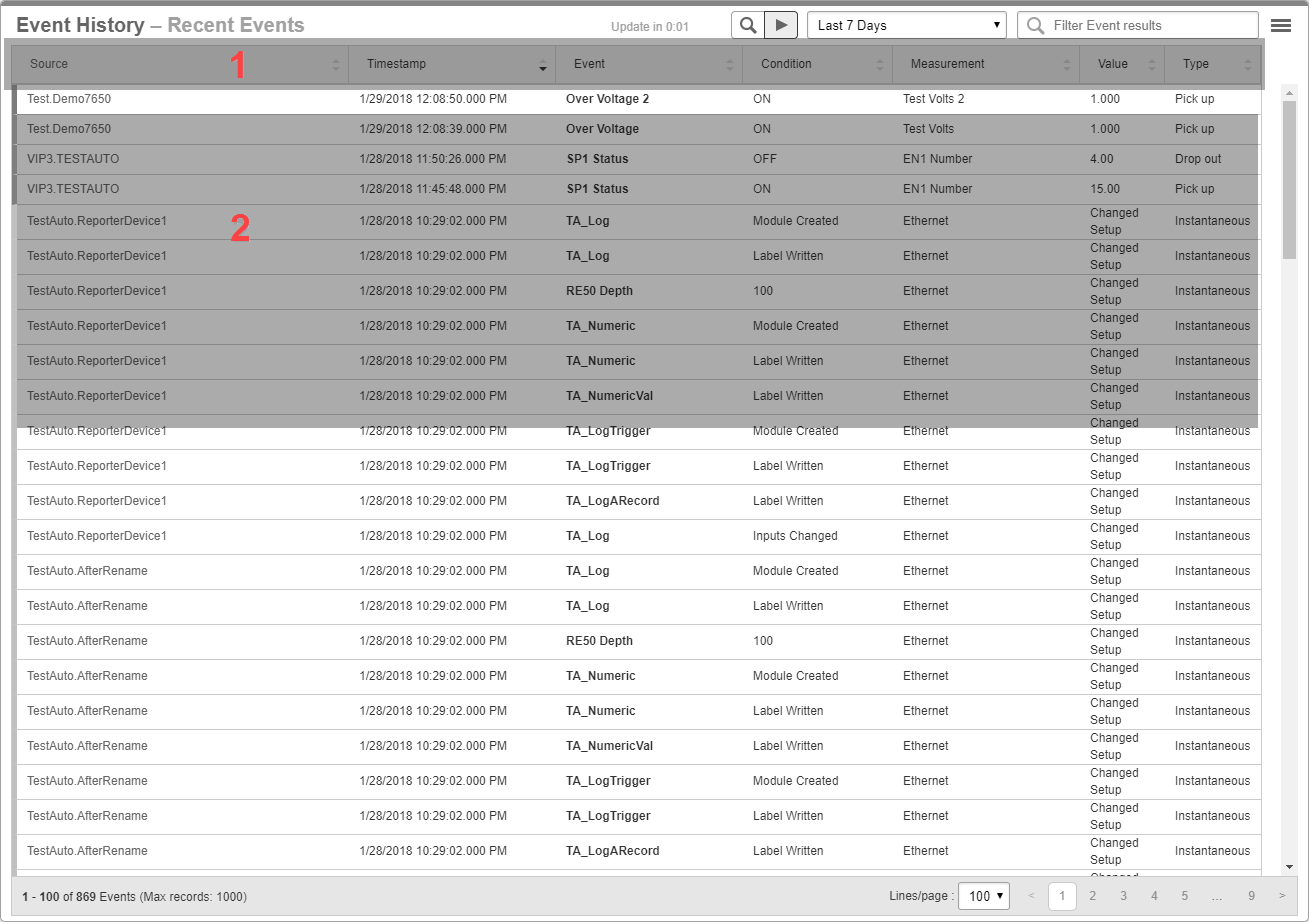
| 1 |
Event history table columns
|
||||||||||||||||||||
| 2 | Event history table rows
Each row in the table shows an event that occurred. The filter settings in the view library control which events are included in a view. |
TIP: Double-click an event row in the table to open the alarm instance details for the alarm that is associated with this event.
7 View settings
| Alarm Status | Alarm and Incident History | Event History |

|

|

|
| 1 | Options menu
The Options menu contains options relevant to the view library. The following options are available: Add View Add Folder |
| 2 | Search filter
Enter text into the search filter to search and filter the views displayed in the library. |
| 3 | Back button
Use the Back button to exit the view settings and go back to the library. |
| 4 | View Name
Set the name of the view in the library. |
| 5 | Location
Determine where the view is stored in the library. |
| 6 |
View Access Permissions selector
NOTE: A public item is visible to all users in your user group. A private item is visible to you and any user in your user group with Edit permissions on this item type. See Default User Access Level Privileges |
| 7 | View Type selector
Select Alarm Status to create an alarm status view. Select Alarm History to create an alarm history view. |
| 8 | Priority filter
Click the priority buttons to include or exclude alarms with that priority. The priorities are, from left to right: No, Low, Medium, High. |
| 9 | State selector
Select which alarm states to include. The following options are available: Active or Unacknowledged Active and Unacknowledged Unacknowledged Active All |
| 10 | Sources selector
Include all sources or select specific sources. |
| 11 |
Category selector
|
| 12 | Level of Detail selector
Select to see incidents, alarms, or events. NOTE: This setting is only available for history views, not for alarm status views. |
| 13 | Priority filter
Select which priority events to include or exclude. This filter allows more precise priority filtering than the other priority filter. NOTE: This selector is only available for event history views, not for alarm status or incident and alarm history views. |
 Date Filter mode: View alarms within a certain date range.
 Auto-Update mode: View the latest alarms.