Sag/Swell Module
The Sag/Swell module monitors voltage inputs for disturbances, which are defined as one or more of the inputs detecting a value above a high limit (swells) or below a low limit (sags or interruptions).
Module icon
![]()
Overview
The Sag/Swell module can be used to detect ITI (CBEMA)-type disturbances. It determines the magnitude and the duration of each disturbance so that they can be plotted on a CBEMA curve.
NOTE: The registers and settings available in this module depend on the device or node you are configuring, as well as its firmware and template versions. Not all registers or settings are available on all devices or the Virtual Processor, and labels may vary.
The primary application for the Sag/Swell module is voltage quality monitoring and analysis. For both utilities and their customers, poor voltage quality can have expensive results. Electrical equipment is designed to operate within certain voltage limits; if there is a disturbance in voltage, equipment can fail or sustain permanent damage. Computer equipment is especially sensitive to disturbances in voltage.
When the Sag/Swell module detects a disturbance, it provides information about the entire disturbance. In addition, it breaks up the disturbance into discrete components, or sub-disturbances, to allow for a more detailed analysis.
Utilities must often be able to prove to their customers that they are delivering high quality, reliable voltage. Likewise, customers must be able to assess voltage quality to ensure it meets the requirements of their equipment. The Sag/Swell module provides data for a detailed historical analysis of voltage quality. It also provides pulse outputs that can be used to trigger additional application logic for waveform logging and data collection.
You can also configure the Sag/Swell module to learn what values the source inputs need to reach for a disturbance to be considered a sag or a swell, and then either to place the learned values in the learned output registers for review or to begin using the learned values automatically. If learning is enabled, learning can occur even if the module itself is not enabled.
The Sag/Swell module can also detect and measure Rapid Voltage Changes (RVC). RVC is a quick transition in RMS voltage occurring between two steady-state conditions, during which the RMS voltage does not exceed the sag/swell thresholds. If the RVC exceeds these thresholds it is considered to be a sag or a swell.
Inputs
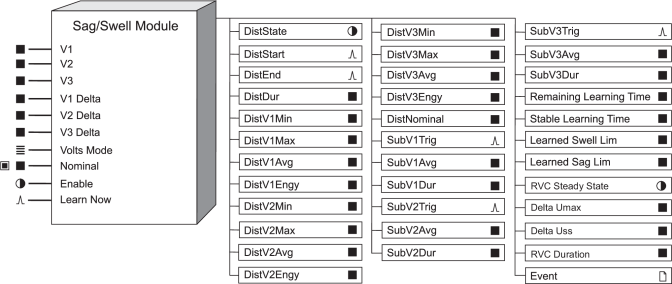
 V1, V2, V3, V1 Delta, V2 Delta, V3
Delta
V1, V2 and V3 are, by default, linked to the line-to-neutral voltages of either the High Speed Power Meter module's outputs or the Power Quality Aggregator module’s half-cycle outputs. If the Volts Mode setup register of the Power Meter module is set for a Wye system, the values from V1 to V3 are used to calculate the Sag/Swell module's output values. You can override this with the Use Vll Always setup register.
V1 Delta, V2 Delta and V3 Delta are, by default, linked to line-to-line voltages of the High Speed Power Meter module’s outputs or the Power Quality Aggregator module’s half-cycle outputs. If the Volts Mode setup register of the Power Meter module is set for a Delta system, the values from V1 Delta to V3 Delta are used to calculate the Sag/Swell module's output values.
 VoltsMode
This input specifies your power system’s configuration. It is linked to the Volts Mode setup register on the High Speed Power Meter module. The VoltsMode value is used to determine which Power Meter outputs (i.e., line-to-neutral or line-to-line) should be used to calculate the Sag/Swell module’s outputs. If the default link to the Power Meter module’s Volts Mode setup register is deleted, V1 to V3 are used in Sag/Swell calculations. The table below shows which Power Meter module outputs are used as inputs to the Sag/Swell module for each VoltsMode setting.
| VoltsMode register setting | Input link to High-Speed Power Meter1 | ||
|---|---|---|---|
| V1 | V2 | V3 | |
| 4W-Wye or 9S - 4 Wire Wye/Delta | Vln a | Vln b | Vln c |
| 3W-Wye or 29S - 4 Wire Wye or 36S - 4 Wire Wye | Vln a | Vln b | Vln c |
| Delta or 35S - 3 Wire | Vll ab | Vll bc | Vll ca |
| Single | Vln a | Vln b | N/A |
| Demo | N/A | N/A | N/A |
1 For some devices, the Sag/Swell inputs link to the High-Speed Power Meter through the Power Quality Aggregator module’s corresponding half-cycle voltage outputs. | |||

 Nominal
This input specifies the nominal voltage of the power system. The Nominal input is read once per half-cycle. If this input is unlinked, the value in the Nom Volts setup register is used as the nominal voltage (see the Nom Volts setup register description in the Setup registers section). If this input is linked, the Nom Volts setup register is ignored. However, it is useful to link it to an appropriate Power Meter module output or Power Quality Aggregator module output (from the same module as the Sag/Swell module’s voltage inputs) if the nominal voltage of the monitored power system tends to drift.
NOTE: Refer to “Enabling power quality for the Sag/Swell module” for details on how to enable power quality functions for this module.
 Enable
This input can enable or disable the module. If the Enable setup register is set to DISABLED, this input is ignored and the module is disabled. Linking this input is optional; if you leave it unlinked, this input is ENABLED by default.
 Learn Now
When this input is pulsed, it starts the learning process and the learning period begins. If a pulse is received while learning is in progress, the current learning period is aborted, any data in the learning-related output registers is reset and a new learning period begins.
This input must be linked for learning to be enabled. If this input is pulsed, learning occurs even if the module is not enabled. However, if any of the module’s setup registers are modified during the learning process, learning is stopped, and learning-related outputs become NOT AVAILABLE. To disable learning entirely, disconnect this input.
Setup registers
These registers define what is interpreted as a disturbance and a sub-disturbance.
 Swell Lim
This register specifies what limit any of the inputs must exceed for the DistState output register to change to TRUE. It is specified as a percentage of the nominal RMS voltage.
- ANSI C84.1 1989 standard recommends a limit of 106% for Range B voltage levels
- IEC 61000-4-30:2015 ed3 standard recommends a limit of 110% or greater.
- EN50160 standard requires measurement of swells exceeding 110% of nominal
Set the Swell Lim to a value between 100 and 1000, inclusive.
If learning is enabled, this register is overwritten by the learned values, either when you install the values in MANUAL MODE or when learning is complete in AUTOMATIC MODE.
 Sag Lim
This register specifies what limit any of the inputs must fall below for the DistState output register to change to TRUE. It is specified as a percentage of the nominal RMS voltage.
- ANSI C84.1 1989 standard recommends for Range B voltage levels a limit of 88% for load voltages and 92% for the service entrance
- IEC 61000-4-30:2015 ed3 standard recommends a range of 85-90%
- EN50160 standard requires measurement of sags exceeding 90% of nominal
Set the Sag Lim to a value between 0 and 100, inclusive.
If learning is enabled, this register is overwritten by the learned values, either when you install the values in MANUAL MODE or when learning is complete in AUTOMATIC MODE.
 ChangeCrit
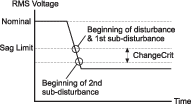
This register provides the means to sub-divide a disturbance into discrete sub-disturbances. It specifies by how much an input must change during a disturbance to be considered a new sub-disturbance. The percentage you define is with respect to the nominal RMS voltage, not the RMS voltage at the time of the change. For example, if your nominal RMS voltage is 120 V and your ChangeCrit is 10%, any voltage drop of 12 VRMS or more during a disturbance marks a new sub-disturbance.
 Hysteresis
Hysteresis is the difference in magnitude between the start and end thresholds for a Sag/Swell. For example, a hysteresis of 5% means that a Sag with a threshold of 90% needs to reach 95% before the Sag is over and a Swell with a limit of 110% needs to reach 105% before the Swell is over.
The purpose of hysteresis in the context of power quality measurements is to avoid counting multiple events when the magnitude of the parameter oscillates around the threshold level.
A hysteresis value of 2% of Nominal RMS voltage is recommended by the IEC 61000-4-30:2015 ed3 standard.
 Nom Volts
This register specifies the nominal RMS voltage of the power system you are monitoring. The value in this register is used for the Sag/Swell module only if the Nominal input is not linked. If the Nominal input is linked, the Nom Volts setup register is not used by the Sag/Swell module. If the Nominal input register is not linked, use this register to enable the power quality features by entering a voltage that represents the nominal voltage for your power system (for example, 120).
NOTE: Refer to “Enabling power quality for the Sag/Swell module” for details on how to enable power quality functions for this module.
NOTE: Nominal refers to the primary power system RMS voltage (line-to-line voltage for Delta systems and line-to-neutral voltage for Wye systems). The power system can be modified with the Use Vll Always setup register. The primary power system voltage is sometimes different than the PT Primary setup register value; i.e. when the PT Primary is used to indicate winding ratio rather than primary voltage.
 EvPriority
This register allows you to assign a priority level to the following Sag/Swell events:
- The DistState output register changes to TRUE or FALSE.
- Setup changes made during a disturbance.
- Module disabled during a disturbance.
 Learn Install
Mode
This register specifies how the learned values are installed:
- MANUAL: Learning occurs but the module is not automatically configured with the learned values when learning is complete. The learned values are placed in the learned output registers for review and manual installation.
- AUTOMATIC: Learning occurs and the learned values are placed in the learned output registers. The module automatically starts using the learned values when learning is complete.
Once the learned values are installed, either manually or automatically, the value of the learned output registers reverts to NOT AVAILABLE.
 Learn Duration
This register specifies the learning duration in days. The allowable range is 1 to 365. The default is 30.
 Enable
This register, if set to DISABLED, disables the module regardless of the Enable input register. If this register is set to ENABLED, the module is enabled or disabled based on the Enable input register.
 Use Vll Always
If this register is set to TRUE or YES, then the module will always evaluate the line-to-line voltages, even when there are line-to-neutral voltages available.
 Enable RVC
When this register is set to YES, the RVC feature is enabled and the Sag/Swell module detects both sag/swells and RVC events. Refer to the Detailed Module Operation section for a description of RVC detection and recording.
 RVC Threshold
This register specifies what limits the RMS voltage must exceed from the mean of the previous 100/120 half cycles for the RVC Steady State register to change to FALSE. The RVC Threshold value is bounded between 0.1 and 100 percent. If, during an RVC event, the RMS voltage exceeds either the Swell Lim or Sag Lim registers, the RVC event is discarded and the event becomes a sag or swell. Refer to the Detailed Module Operation section for a description of RVC detection and recording.
 RVC Hysteresis
RVC Hysteresis is the difference in magnitude between the start and end thresholds for an RVC event. The purpose of hysteresis in the context of power quality measurements is to avoid counting multiple events when the magnitude of the parameter oscillates around the threshold level. This register value must be less than the RVC threshold value. Refer to the Detailed Module Operation section for a description of RVC detection and recording.
Output registers
With the exception of the learned output registers, the following output registers provide data about a disturbance as a whole and about all the sub-disturbances that comprised it. The data provided by these registers is historical rather than realtime; the disturbance values are not calculated until the end of the disturbance, and the sub-disturbance values are not calculated until the end of the sub-disturbance. The pulse registers are provided to trigger Data Recorder modules so the values can be logged and later analyzed. The learned output registers show the results of the learning process.
 DistState
This Boolean register is TRUE when the RMS value of one or more of the inputs strays outside the limits defined by the Swell Lim and Sag Lim setup registers. This situation is referred to as a 'disturbance'. DistState is FALSE when all inputs fall within the limits, taking into account hysteresis.
 DistStart
This pulse register outputs a pulse when a disturbance is detected.
 DistEnd
This pulse register outputs a pulse when the RMS value of all inputs have returned to within the limits defined by the Swell Lim, Sag Lim and Hysteresis setup registers.
 DistDur
This register contains the duration of the last disturbance in seconds.
 DistV1Min, DistV2Min, DistV3Min
These registers contain the minimum magnitude reached during the last disturbance on V1, V2 and V3, respectively. They are expressed as a percentage of the nominal voltage. For example, on a 120 V nominal system, if V1 sags from 120 V nominal to 90 V, the DistV1Min register will contain 75.
 DistVMin
This register contains the minimum of DistV1Min, DistV2Min or DistV3Min from the last disturbance. For example, if DistV1Min is 80, DistV2Min is 77 and DistV3Min is 82, the DistVMin will contain 77.
 DistV1Max, DistV2Max, DistV3Max
These registers contain the maximum magnitude reached during the last disturbance on V1, V2, and V3, respectively. They are expressed as a percentage of the nominal voltage. For example, on a 120 V nominal system, if V2 swells from 120 V nominal to 150 V, the DistV2Max register will contain 125.
 DistVMax
This register contains the maximum of DistV1Max, DistV2Max or DistV3Max from the last disturbance. For example, if DistV1Max is 120, DistV2Max is 118 and DistV3Max is 131, the DistVMax register will contain 131.
 DistV1Avg, DistV2Avg, DistV3Avg
These registers contain the average magnitude during the last disturbance on V1, V2 and V3, respectively. They are expressed as a percentage of the nominal voltage. For example, on a 120 V nominal system, if the average V3 voltage throughout a disturbance is 30 V, the DistV3Avg register will contain 25.
 DistV1Engy, DistV2Engy, DistV3Engy
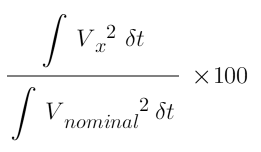
These registers contain the energy delta during the last disturbance on V1, V2, and V3, respectively. They indicate how much extra energy was present during the disturbance or how much was lacking. These registers are expressed as a percentage of nominal voltage energy and are calculated according to the following formula (where Vx is either V1, V2, or V3):
 DistNominal
This register holds the nominal voltage value that was in effect at the beginning of a disturbance.
 SubV1Trig, SubV2Trig, SubV3Trig
These registers output a pulse at the boundary between sub-disturbances on V1, V2, and V3 respectively. This includes the beginning of the disturbance (which is also the beginning of the first sub-disturbance), the beginning of any new sub-disturbances, and the return to normal voltage.
For example, there is a pulse on SubV1Trig when V1 falls outside the Swell Lim and Sag Lim setup registers, when a new sub-disturbance occurs on V1, and when V1 returns to within the Swell and Sag Limits.
 SubV1Avg, SubV2Avg, SubV3Avg
These registers contain the average magnitude during the previous sub-disturbance on V1, V2 and V3 respectively. These values can be used to plot the sub-disturbance on a Magnitude vs. Duration curve (such as CBEMA).
 SubV1Dur, SubV2Dur,
SubV3Dur
These registers contain the duration (in seconds) of the previous sub-disturbance on V1, V2 and V3 respectively. These values can be used to plot the sub-disturbance on a Magnitude vs. Duration curve (such as CBEMA).
 Remaining Learning Time
This register contains the remaining learning time, in seconds. It counts down from the Learn Duration to 0 (zero). When this value reaches zero, learning is complete. If the Stable Learning Time reaches one-quarter of the Learn Duration, this register jumps to zero and learning is complete. If learning has not started, the value of this register is NOT AVAILABLE.
 Stable Learning Time
This register contains the time, in seconds, that has elapsed since a change in the learned values. When this value is equal to one-quarter of the Learn Duration, learning is complete. If learning has not started, the value of this register is NOT AVAILABLE.
 Learned Swell Lim (Learned Swell
Limit)
This register contains the learned value for the Swell Lim setup register. When learning is in progress, this register is continually updated. This register becomes NOT AVAILABLE and learning stops when any setup is changed, for example, when the Learn Now input is unlinked or the value of the Sag Lim register is changed.
 Learned Sag Lim (Learned Sag Limit)
This register contains the learned value for the Sag Lim setup register. When learning is in progress, this register is continually updated. This register becomes NOT AVAILABLE and learning stops when any setup is changed, for example, when the Learn Now input is unlinked or the value of the Swell Lim register is changed.
 Delta Umax
This register contains the maximum RMS deviation during an RVC event on any phase, measured in volts. Refer to the Detailed Module Operation section for a description of RVC detection and recording.
 Delta Uss
This register contains the difference between the steady state mean before and after an RVC, measured in volts. Refer to the Detailed Module Operation section for a description of RVC detection and recording.
 RVC Duration
This register contains the duration of the last RVC event in seconds. Refer to the Detailed Module Operation section for a description of RVC detection and recording.
 RVC Steady State
This register is TRUE if the RMS voltage is steady and no RVC event is detected; namely if all of the previous 100/120 half cycle values (including hysteresis, if applied) are within the RVC threshold of the mean of those values. Refer to the Detailed Module Operation section for a description of RVC detection and recording.
 Event
Event
All events are recorded in the Event register.
Possible events and their associated priority numbers are:
| Event priority group | Priority | Description |
|---|---|---|
| Setup Change | 10 | Input links, setup registers or labels have changed, or learned values have been automatically installed. |
| Information | * | NOT AVAILABLE input caused output to go NOT AVAILABLE while a disturbance was present; Input not Available; Nominal is ≤ 0; VoltsMode changed; Module Disabled. |
| Setpoint | * | Disturbance started; Disturbance ended; RVC event started, RVC event ended; setup changed while a Disturbance was present; module disabled while a Disturbance was present. |
| Install Failed | 10 | Automatic installation of a learned value failed because the value was invalid; invalid value is reported. |
| Unable to Install | 30 | Automatic installation of learned values failed for an unknown, unrecoverable reason. |
* The priority of these events is determined by the value in the EvPriority setup register. | ||
The Event output register stores the following information for each ION event: timestamp, priority, cause, effect, and any values or conditions associated with the cause and effect.
Detailed module operation
A major concern about disturbances in power quality is the adverse effect sags and swells can have on electrical equipment. These effects can range from a momentary disruption in operation to permanent damage, all of which can be expensive.
The severity of a sag or a swell in voltage is determined by a combination of how large it was and how long it lasted. A piece of equipment may be able to tolerate a large but short duration disturbance in voltage. Likewise, it may be able to tolerate a disturbance that is small but longer in duration.
Enabling power quality for the Sag/Swell Module
To enable power quality monitoring features in the Sag/Swell Module, you must enable the module using the Enable input register, and provide nominal voltage information by configuring the Nominal input register or the Nom Volts setup register as follows:
- the Enable input register is either not linked (enabled by default) or linked and enabled.
- the Enable setup register is set to ENABLED.
- the nominal voltage is provided by one of the following:
- the nominal voltage is entered into the Nom Volts setup register, and the Nominal input register is not linked.
- the Nominal input register is linked to the nominal voltage value in the Factory module.
- the Nominal input register is linked to the Power Quality Aggregator module’s Sliding Reference Voltage output register or any other voltage measurement output.
- If the Nom Volts setup register is linked to other modules in your template, it must be configured for the other modules to operate as intended, or the other modules should be relinked to an appropriate source.
Power Tolerance Curves
The ITI (CBEMA) curve is a power tolerance curve that describes what types of disturbances electrical equipment can typically ride through, and what types can cause equipment failure or damage. It plots the magnitude of the disturbance (in percentage) on the Y-axis and the duration of the disturbance on the X-axis.
Disturbances that fall within the envelope defined by the upper and lower curve are typically not harmful to electrical equipment; disturbances that fall outside the envelope may disrupt or damage the equipment.
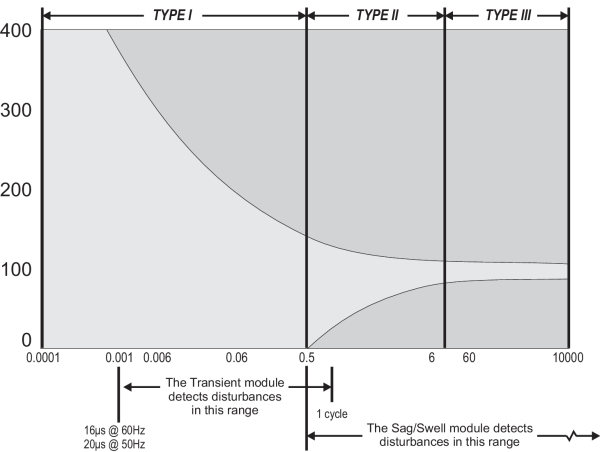
NOTE: These values are representative and depend on your meter’s specifications and sampling rate. Refer to your device's documentation.
CBEMA is not the only power tolerance curve available. ANSI Standard C84.1 also defines a curve that places an upper and lower bound on voltage excursions of different durations. If you plot the magnitude and duration of the sub-disturbances detected by the Sag/Swell module, you can overlay either of these curves, or a custom power tolerance curve, to see if equipment might be affected by the sub-disturbance.
Disturbance Categories as Defined by IEEE
The IEEE 1159 standard categorizes a wide range of electrical disturbances according to their typical duration and magnitude. The categories that are addressed by the Sag/Swell module include short-duration variations and longduration variations. The figure below summarizes these categories:
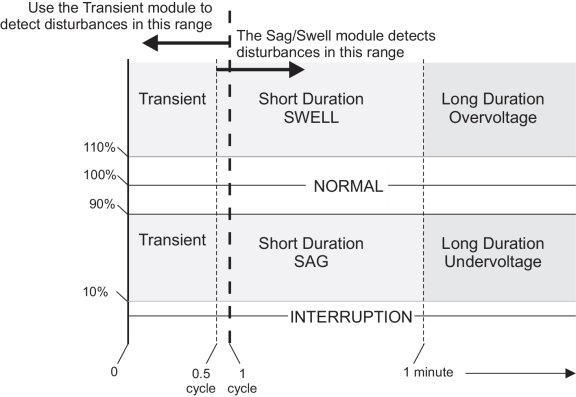
Sags and swells are described as short-duration variations; under and overvoltages are described as long-duration variations. When the voltage drops below a specified percentage of the nominal voltage (usually 10% or less), it is called an interruption. The values shown here are representative, refer to the power quality standards supported by your device for details.
As a disturbance progresses, it likely moves through several of these categories. It is not until the voltage has returned to the normal parameters that the disturbance can be categorized. Even then, a single disturbance often cannot be categorized because there were many. To address this, the ChangeCrit setup register allows you to break the disturbance into sub-disturbances.
Disturbance Sub-Divisions
Within a complex disturbance, the voltage may fluctuate before returning to within the limits defined by the Swell Lim and the Sag Lim setup registers. Disturbances such as these cannot be plotted on a Magnitude vs. Duration graph since there can be many different magnitudes throughout the disturbance, each one sustained for a different duration. To address this, the Sag/Swell module breaks the disturbance up into sub-disturbances so that each part of the disturbance can be recognized and analyzed independently. During a disturbance, if the voltage on an input changes by more than the amount specified in the ChangeCrit register, the corresponding SubTrig output register will pulse, marking the beginning of a new sub-disturbance.
The highlighted circle indicate changes in the input that were less than the ChangeCrit setup register. In these cases, there was no new sub-disturbance. This diagram shows a sag disturbance on the V1 input. In this example, the nominal voltage is 120V, the ChangeCrit setup register is set to 10%, the Sag Lim is set to 90%, and the Hysteresis is set to 2%.
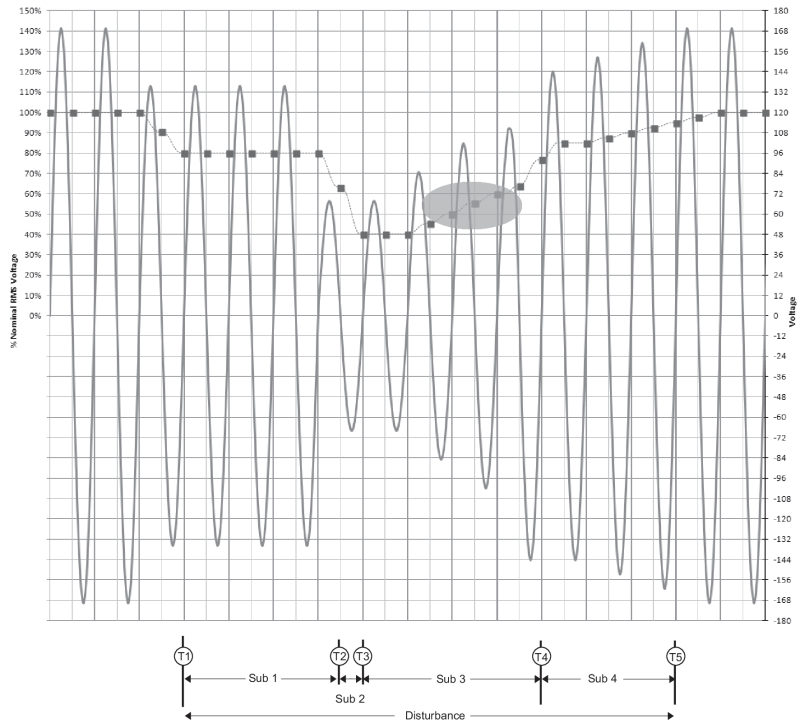
T1 This is the beginning of the disturbance as well as the beginning of the first sub-disturbance. At 80%, the voltage is far below the necessary sag limit of 88% (considering the 2% hysterisis). At this point, the output registers are:
- DistState = ON
- DisStart pulses
- SubV1Trig pulses
- SubV1Avg = Not Available (no previous sub-disturbance, normal operation)
- SubV1Dur = Not Available (no previous sub-disturbance, normal operation)
T2 This is the beginning of the second sub-disturbance because the voltage has changed by more than 10% of nominal. At this point, output registers are:
- DistState = ON
- SubV1Trig pulses
- SubV1Avg = average magnitude of sub-disturbance 1
- SubV1Dur = duration of sub-disturbance 1
T3 This is the beginning of the third sub-disturbance because the voltage has changed by more than 10% of nominal. At this point, output registers are:
- DistState = ON
- SubV1Trig pulses
- SubV1Avg = average magnitude of sub-disturbance 2
- SubV1Dur = duration of sub-disturbance 2
T4 This is the beginning of the fourth sub-disturbance because the voltage has changed by more than 10% of nominal. At this point, output registers are:
- DistState = ON
- SubV1Trig pulses
- SubV1Avg = average magnitude of sub-disturbance 3
- SubV1Dur = duration of sub-disturbance 3
Note that with Hysteresis set to 2%, the voltage must reach 92% (90 + 2) before the sag is registered as over.
T5 This is the return to normal operating parameters (within the Swell and Sag Limits). At this point, output registers are:
- DistState = OFF
- Distend pulses
- SubV1Trig pulses
- SubV1Avg = average magnitude of sub-disturbance 4
- SubV1Dur = duration of sub-disturbance 4
Rapid Voltage Changes
A rapid voltage change (RVC) is a quick transition in RMS voltage occurring between two steady state voltages, and during which the RMS voltage does not exceed the Sag Lim or Swell Lim threshold values.
Steady state occurs when the previous 100/120 Urms(1/2) values (approximately one second), are within the RVC threshold of the arithmetic mean of those values.
On a three phase system the steady state calculation is done per phase. The RVC Steady State is the logical AND of the phases.
If any Urms(1/2) value falls outside of the Sag Lim or Swell Lim on any phase, then any ongoing RVC event is discarded. It is either a sag or a swell.
The RVC start and RVC end events are recorded in the event log after the RVC event has ended and the RVC Steady State register is set to TRUE.
Example: decrease in RMS voltage that results in an RVC event
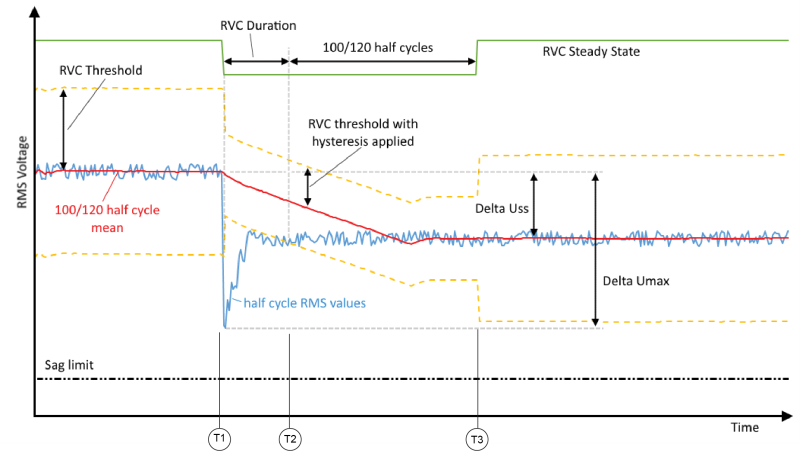
T1 This is the beginning of the RVC event, which is triggered by the Urms(1/2) exceeding the RVC threshold. The RVC Steady State output register changes from TRUE to FALSE.
T2 The value of the Urms(1/2) falls within the RVC Threshold (with hysteresis applied).
T3 A full second of cycles has elapsed where the Urms(1/2) has stayed within the RVC Threshold. The RVC start and end events are recorded in the event log, the RVC Steady State register changes from FALSE to TRUE and the Delta Uss and Delta Umax registers are updated
Responses to special conditions
The following table summarizes how the module behaves under different conditions.
| Condition | Response of output registers |
|---|---|
| When the module is first created | All numeric and Boolean output registers are NOT AVAILABLE. |
| If V1, V2, V3, V1 Delta, V2 Delta or V3 Delta is not linked | All numeric and Boolean output registers related to that input are NOT AVAILABLE. |
| If V1, V2, V3, V1 Delta, V2 Delta or V3 Delta is NOT AVAILABLE | All numeric and Boolean output registers related to that input are NOT AVAILABLE. |
| If the Enable input is OFF | All numeric and Boolean output registers that are not related to learning are NOT AVAILABLE. |
| After the module is re-linked or its setup registers are changed | All numeric and Boolean output registers are NOT AVAILABLE. |
| When the device is powered up (either the first time, or after a shutdown) | All output registers are NOT AVAILABLE. |
| If learning is not in progress and no learned values are waiting to be installed | Learned output registers are NOT AVAILABLE. |
| If V1, V2, V3 or V1 Delta, V2 Delta, V3 Delta or the Nominal input are NOT AVAILABLE, or there are any changes to the module’s setup | Learning stops and is reset, and the learned output registers are NOT AVAILABLE. |