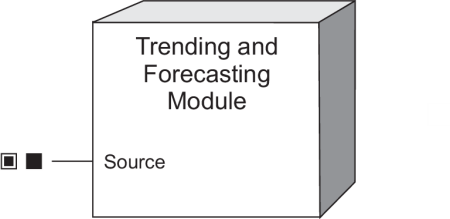
Trending and Forecasting Module
The Trending and Forecasting Module lets you record long-term changes in data.
Module icon
![]()
Overview
The information provided by the module allows you to forecast values such as demand so you can better manage things such as demand charges and time-of-use billing rates. Trend analysis can also be useful for predictive maintenance, by allowing you to see changes in load and power quality.

Average, minimum, maximum and standard deviation data are logged for the source at the following intervals:
- Every hour for the last 24 hours
- Every day for the last month
- Every week for the last 8 weeks
- Every month for the last 12 months
This data is used to graph trends and calculate forecasted values. The results can be viewed through the meter’s webpages by entering the meter’s IP address into your browser. For more information on viewing the Trending and Forecasting web pages for your meter, refer to your meter’s user manual.
NOTE: The registers and settings available in this module depend on the device or node you are configuring, as well as its firmware and template versions. Not all registers or settings are available on all devices or the Virtual Processor, and labels may vary.
Inputs

 Source
This source is logged for trending and forecasting. Data is logged at hourly, daily, weekly and monthly intervals and used to calculate forecasted values. The Source input can be linked to the numeric output register of any other module. This input must be linked for the Trending and Forecasting module to operate. If the input is re-linked or unlinked, all data logged for the previous source is deleted.
NOTE: If the Source is N/A, the module continues to run but no data is logged and no points are added to the webpage for the duration for which the Source is N/A.
Setup registers
 Start Day of Week
This register sets which day is the start of a week for the purposes of this module. This day is used for determining weekly accumulated averages. The default is Monday. If you change this register, all currently accumulated data is deleted.
Output registers
This module has no output registers.
Detailed module operation
Below is an overview of how the trending and forecasting data is accumulated:
- At the end of a 1-second interval, the present value of the source is added to a running sum of the current minute. The value is only added if it is valid; it is valid as long as the source input is not N/A for that 1-second interval.
- At the end of a 1-minute interval, the values accumulated within the last 60 seconds are averaged if there are more than 30 valid samples (at least 50% of the samples were valid during the 60 second interval). This average is then included with the 1-minute averages for the most recent 60 minutes. The 1-second data is then reset.
- At the end of the hourly, daily, weekly and monthly intervals, the averages accumulated within that interval are averaged. This average is then included with the existing averages for the interval; for example, the hourly average is added to a data structure containing averages for the last 24 hours. The interval average is only valid if at least 50% of the values used to calculate the average are valid; i.e., for an hourly average to be valid and added, 30 or more minute values must have been valid.
- An algorithm is used to calculate forecasted values. The algorithm uses a profile value that is calculated from the accumulated averages. This profile value is used along with the previous 2 profile values to determine the forecasted values.
Forecasted values are calculated for the next four intervals; i.e., if you are looking at the hourly graph, you will see forecasted values for the next four hours.
It can take time for a module to build up enough data to create an adequate profile for a channel in order to display information on the Trending and Forecasting web page.
The trending data and accumulated values are backed up to the meter’s nonvolatile memory every hour. Since the data needs to be accumulated over time in order to build a useful profile, it is important that it persists through power cycles.