Dialog 'XY Chart Configuration'
Symbol: ![]()
Function: The dialog contains the configuration of the Cartesian XY chart which visualizes the data from an array.
Call: Click ![]() XY Chart in the Cartesian XY Chart property.
XY Chart in the Cartesian XY Chart property.
Requirement: An XY chart is selected in the active visualization editor and the corresponding Properties view is open.
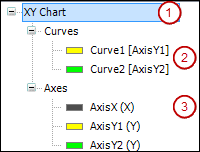
The tree view to the left of the dialog visualizes the configuration of the XY chart and acts as a navigator. If you have selected the top-level entry (1) or nothing at all, then the Element Settings group is visible on the right. This configuration includes the chart refresh frequency. Moreover, settings are available that influence the appearance and functionality of the chart.
If you have selected an entry below the Curves node (2), then the Curve Settings group is visible on the right. This configuration includes the Y-coordinate axis assigned to the selected curve and the array data that the curve visualizes. Moreover, settings are available that influence the appearance and functionality of the selected curve. The entry shows the name of the curve with the assigned coordinate axis in parentheses. For example, Curve1 [AxisY1] means that the vertical ordinate axis AxisY1 is assigned to the curve Curve1.
If you have selected an entry below the Axes node (3), then the Axis Settings group is visible on the right. This configuration includes the location of the Y-coordinate axis in the chart. Moreover, settings are available that influence the appearance and functionality of the selected coordinate axis. The entry shows the name of the axis with its function in parentheses. An axis can act as either an X-axis or Y-axis. For example, AxisX(X) means that the axis AxisX acts as a horizontal abscissa axis X.
Group 'Element Settings'
|
Type |
|
|
Variable |
Variable (integer data type) Available if the type Variable is selected. See example: Variable |
Example: Variable
Declaration
PROGRAM Sine
VAR_INPUT
   uiUpdate : UINT;
END_VAR
Assignment
Sine.uiUpdate|
Type |
|
|
Color |
Available if the type Plain color is selected. |
|
Transparency |
Value (0 to 255) for defining the transparency of the selected color.
Example Available if the type Image is selected. |
|
Image ID |
Example: Available if the type Image is selected. |
|
Transparent color |
Available if the type Image is selected. |
|
Scaling type |
Available if the type Image is selected. |
|
Type |
|
|
Line style |
Example: Dots
Not available if the type |
|
Color |
|
|
X position variable |
Variable (integer data type) in which the cursor X-position is written.
Example:
Not available if the type |
|
Element variable |
Variable with data type The variable configured here is initialized with the static configuration. In runtime mode, the Cartesian XY Chart element responds to changes in this structure. As a result, the element can be controlled programmatically in runtime mode. See example: Element variable |
|
Automatic update enable |
Variable (data type
Example: Note: Available when the type Automatic is selected in Update. |
Example: Element variable
Declaration
PROGRAM Sine
VAR_INPUT
   XYGraph : VisuStructXYChart;
END_VAR
Assignment
Sine.XYGraph|
The cursor type of the additional cursor corresponds to the main cursor. |
|
|
Line style |
Example: Dots |
|
Color |
|
|
Type |
Grid displayed as
|
|
Line style |
Example: Dots
Not available if the type |
|
Color |
|
|
Grid behind the curves |
|
Group 'Curve Settings'
The settings are related to the curve selected in the tree view.
|
Attached to Y-axis |
Y-axis that is assigned to the selected curve. The Y-axis can have multiple curves assigned to it. The drop-down list includes all axes that were created in the element. Example: Y |
|
Variable |
Array variable of base data types, custom data types, or function blocks. This variable contains the curve data for the X- or Y-data.
Note: Set a fixed scaling for an axis only if you know the value range. Otherwise, we recommend that you set automatic scaling. See: Examples |
|
Element to use |
The array element of the complex data type that is used. Available if the data type of Variable is the array of a complex data type (consisting of multiple elements):
|
Example: Two-dimensional array of the base type REAL
Declaration
PROGRAM Curve
VAR
   aDataXY : ARRAY [1..2, 1..50] OF REAL;
END_VAR
Data X
Variable: Curve.aDataXY
Element to use: [1]
Data Y
Variable: Curve.aDataXY
Element to use: [2]
Then 100 array values are displayed in this curve.
Example: One-dimensional array of a user-defined data type
Declaration
TYPE STRUCT_A :
STRUCT
        iX: INT;
        rY: REAL;
        bResult: BOOL;
END_STRUCT
END_TYPE

PLC_PRG
VAR
        aDataXY : ARRAY [1..50] OF STRUCT_A;
END_VAR
Data X
Variable: aDataXY.iX
Element to use: iX
Data Y
Variable: aDataXY.rY
Element to use: rY
Example: One-dimensional array of the structure POINT
PLC_PRG
VAR
        aPoints_1: ARRAY[0..99] OF POINT; // POINT is a structure with iX and iY
END_VAR
Data X
Variable: PLC_PRG.aPoints_1
Element to use: iX
Data Y
Variable: PLC_PRG.aPoints_1
Element to use: iY
Then 200 X- and Y-values are available which are displayed in the chart in 100 curve points.
Example: One-dimensional array of a function block
Declaration
FUNCTION_BLOCK FB_A
VAR_INPUT
        iIn: INT;
END_VAR
VAR_OUTPUT
        iOut: INT;
END_VAR
PROGRAM PLC_PRG
VAR
        aDataXY : ARRAY [1..50] OF FB_A;
END_VAR
Data X
Variable: PLC_PRG.aDataXY
Element to use: iIn
Data Y
Variable: PLC_PRG.aDataXY
Element to use: iOut
|
The array indices limit the display of the curve to a partial area. Instead of all points being displayed in the XY chart, only the points from Minimum to Maximum are displayed. Minimum and Maximum are indexes that must not violate the index limits. The compiler also monitors this. Pick the index limits of the array declaration.
Example:
Moreover, you can limit the display programmatically in the instance of In addition, you can limit the display area only one-sided, and specify only one Minimum or only one Maximum. When you do not specify a limit here or in the structure, the curve is displayed completely. When you specify variables (numeric data type) as array indices, you can make the display dynamic.
Numeric data type: |
|
|
Minimum |
Minimum index as literal, variable (numeric data type), or constant variable (numeric data type)
Specifies the index from which the curve is displayed. The index is greater than or equal to the index limit
Example: |
|
Maximum |
Maximum index as literal, variable (numeric data type), or constant variable (numeric data type)
Example:
Contains the index to which the curve is displayed. The index is less than or equal to the index limit |
|
Type |
|
|
The following settings are available when the type Line chart is selected. |
|
|
Line color |
|
|
Line type |
|
|
Line width |
Example: |
|
Line style |
Example: |
|
Point style |
|
|
The following settings are available when the type Bar chart is selected. |
|
|
Bar shape |
|
|
Main color |
|
|
Alternative color |
|
|
Frame color |
|
|
The following settings are available when the type Area chart is selected. |
|
|
Line color |
Example: Blue
|
|
Fill type |
Color for filling the area between the curves.
|
|
Fill color |
Example: Gray
Requirement: Plain color is selected in Filling type.
|
|
Transparency |
Transparency value (0 - 255) for the color.
Example: Requirement: Plain color is selected in Filling type. |
|
Gradient |
Area filled with a color gradient.
Requirement: Gradient is selected in Filling type. |
|
Line width |
Example: |
|
Line style |
Example: |
|
Point style |
The data is displayed in the chart as dots in point style.
|
|
Curve value captured by the cursor |
Variable (integer data type) in which the Y-position of the cursor is written to the curve.
Example: |
|
Curve variable |
Variable (data type The variable configured here is initialized with the static configuration. In runtime mode, the Cartesian XY Chart element responds to changes in this structure. As a result, the element can be controlled programmatically in runtime mode. See example: Curve variable |
Group 'Axis Settings'
The settings are related to the axis selected in the tree view.
|
Position |
|
|
Minimum Maximum |
Minimum and maximum limit of the axis value within which the curve is displayed. Limit specified as
Numeric data type: Note: Visible only when Autoscale is disabled. |
|
Autoscale |
|
|
Axis color |
|
|
Type |
|
|
Color |
Available if the type Plain color is selected. |
|
Transparency |
Value (0 to 255) for defining the transparency of the selected color.
Example Available if the type Plain color is selected. |
|
Image ID |
Example: Available if the type Image is selected. |
|
Transparent color |
Available if the type Image is selected. |
|
Scaling type |
Available if the type Image is selected. |
|
Axis variable |
Variable (data type The variable configured here is initialized with the static configuration. In runtime mode, the Cartesian XY Chart element responds to changes in this structure. As a result, the element can be controlled programmatically in runtime mode. See example: Axis variable |
Example: Axis variable
Declaration
PROGRAM Sine
VAR_INPUT
   AxisX : VisuStructXYChartAxis;
END_VAR
Assignment
Sine.AxisX|
Display ruler Axes overlap in origin Display numbers Display of maximum number Display of minimum number Display of numbers in the middle Overwrite numbers |
|
|
Text ID |
Example: |
|
Color |
Available if Test ID is initialized. |
|
Rotation |
Available if Test ID is initialized. |
|
Font |
Available if Test ID is initialized. |
|
Line along the axis. The line is horizontal for a Y-axis and vertical for an X-axis. Maximum of 10 lines are possible. |
|
|
Line number |
Addresses the line and results in the corresponding parameter settings being displayed for this line in the window area below Parameter for line <n>.
Example: |
|
Parameter for line <n> |
|
|
Value |
Example: |
|
Maximum of 10 lines are possible. |
|
|
Line style |
Example: Dots |
|
Line width |
Example: |
|
Color |
|
|
Label text ID |
Example: |
|
Label position |
|
|
Label rotation |
Available if Test ID of the label is initialized. |
|
Font |
Available if Test ID of the label is initialized. |
See also